
Chart-to-text, A Massive Benchmark For Chart Summarization, Is Here!
3 main points
✔️ Constructed a large-scale benchmark, Chart-to-text, consisting of two datasets and 44096 charts
✔️ Created a baseline using this dataset and a state-of-the-art neural network model
✔️ Rated metrics and human ratings were performed on the baseline to Generate natural summaries and achieved reasonable BLEU scores
Chart-to-Text: A Large-Scale Benchmark for Chart Summarization
written by Shankar Kantharaj, Rixie Tiffany Ko Leong, Xiang Lin, Ahmed Masry, Megh Thakkar, Enamul Hoque, Shafiq Joty
(Submitted on 12 Mar 2022 (v1), last revised 14 Apr 2022 (this version, v3))
Comments: ACL 2022
Subjects: Computation and Language (cs.CL)
code:

The images used in this article are from the paper, the introductory slides, or were created based on them.
Introduction
Data visualizations such as bar, line, and pie charts are essential for analyzing quantitative data, and automatic chart summarization, which provides natural language summaries from charts, is an important Automatic chart summarization, which summarizes charts in natural language, is an important task to help people gain important insights from charts.
However, this chart summarization task has received little attention to date, mainly due to two problems
- Lack of an extensive data set to perform this task using the latest neural network models
- No strong baseline in this task using the latest neural network model
This paper describes a paper that addresses the above problem by building a large-scale benchmark for the chart summarization task using two datasets consisting of 44096 broad topics and various types of charts, and baselines using state-of-the-art neural network models.
Chart-to-text Dataset
In this paper, the following steps were used to construct the dataset.
data collection
After searching a variety of sources, including news sites, textbooks, and websites, we were able to locate the following two sources with charts with descriptions in sufficient numbers and a variety of texts
- Statista: an online platform that regularly publishes charts on a wide range of economic, market, and polling topics, with a total of 34811 charts retrieved from 34810 web pages published in December 2020
- The Pew Research: a website that publishes articles on social issues, public opinion, and data on population trends, with a total of 9285 charts taken from 3999 web pages published in January 2021
For each chart obtained, we downloaded the image, surrounding paragraphs, and related text, and manually categorized each chart as simple or complex.
data annotation
For each chart on each of the two websites collected, we annotated its summary text.
For charts retrieved from Statista, we annotated the first part of the text accompanying the chart as the chart summary text The first part of the text accompanying the chart was annotated as a summary text of the chart.
On the other hand, Pew Research had a problem that it was difficult to simply obtain the text attached to the charts because many charts are included in the web pages, so we used the procedure shown in the figure below to annotate the charts.
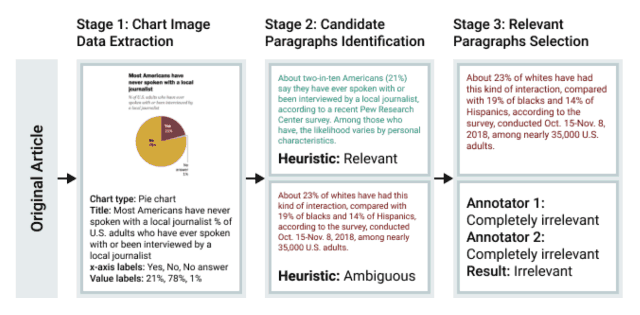
- Detect text from charts using CRAFT, a state-of-the-art OCR model
- Classify detected text into one of the following categories by gradient boosting: title, axis label, legend, or data label
- Annotate each chart and associated paragraph
Data Set Analysis
As shown in the table below, the dataset includes various types of charts, such as bar charts (Bar) and line charts (Line ), covering a wide range of topics such as Economy&Politics, Society, and Health. Health, and more.
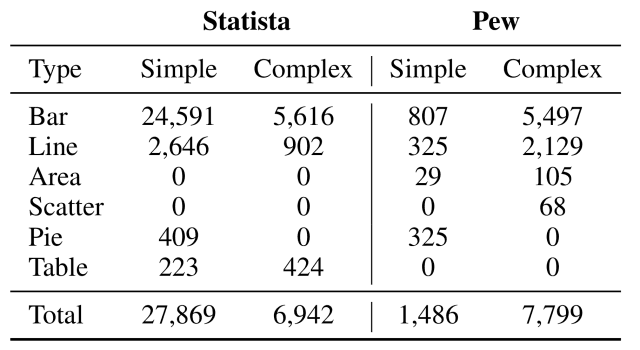
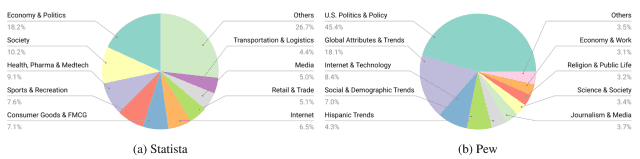
Chart-to-text Baseline Models
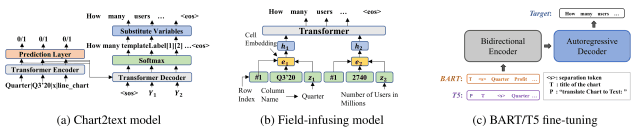
This paper created a baseline model using the three models shown in the figure below.
-
Chart2text model (Obeid and Hoque, 2020): Transformer model based on the data-to-text model of Gon et al. (2019), modified for chart-to-text
-
Field-infusing model (Chen et al., 2020): model created based on concept-to-text work (Lebret et al., 2016)
- BART (Lewis et al., 2020): a model employing the seq2seq Transformer architecture for pre-training noise removal, pre-trained for the text generation task
- T5 (Raffel et al., 2020): a unified seq2seq Transformer model to convert various NLP tasks to text2text
If there is a data table for the input, it is used as is; if not, all OCR texts are concatenated in order from top to bottom and given to the model as input.
Chart-to-text Evaluation
Finally, automatic evaluation by the evaluation index and human evaluation was performed on the baseline.
Automatic Evaluation
The following five metrics were used in the automated evaluation
- BLEU: A measure of how similar the correct answer is to the model-generated sentences.
- CS (Content Selection): Similar to BLEU, this indicator measures how similar the correct answers are to the model-generated sentences.
- BLEURT: A model-based evaluation index that measures how grammatically correct a generated sentence is.
- CIDEr: Index used to evaluate the caption generation model for an image by calculating the n-gram overlap weighted by TF-IDF
- PPL (Perplexity): A metric used in language models that is smaller if it correctly predicts the correct word in the generated sentence.
The results using the above evaluation indicators are shown below. (TAB- refers to models using data tables and OCR- refers to models using data extracted by OCR)
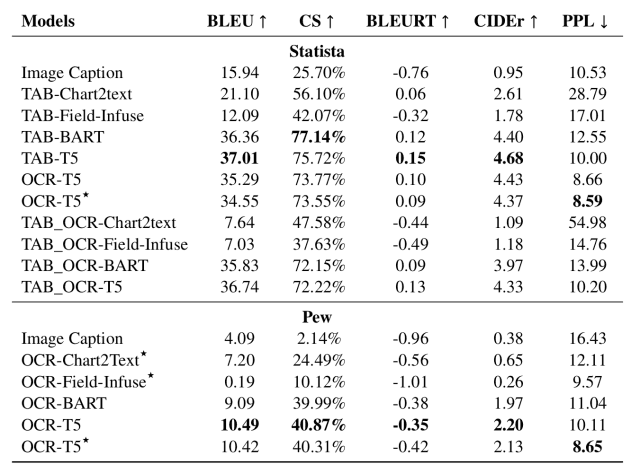
From this table, we found the following
- Large-scale pre-training models (BART, T5) show a significant improvement in summarization performance
- In Statista, given a data table, the Chart2text and Field-Infuse models can extract information from the data table but have difficulty generating high-quality summary statements (likely because these models have not been trained in advance on a large scale).
- On the other hand, TAB-BART and TAB-T5 can generate structured and appropriate summary sentences
- OCR-based models are generally capable of generating high-quality summaries, but the OCR process introduces noise into the input data, resulting in a slightly lower ability to extract relevant information.
Thus, we found that large-scale pre-training models such as BART and T5 have the best summarization performance.
Human Evaluation
To further evaluate the quality of the generated summary statements, this paper evaluated 150 charts randomly sampled from the Statista dataset by four native English-speaking annotators.
For each chart, annotators compared summary statements based on the following three criteria
- Factual: Which summary statement is more factually correct (i.e., are the facts mentioned supported by the chart)?
- Coherence: Which summary statement is more coherent (i.e., the sentences are well connected)?
- Fluency: Which summary statement is more fluent and grammatically correct?
For each criterion, annotators chose the former as better (Summary 1 Win), the latter as better (Summary 2 Win), or a tie (Tie).
Comparison results are shown below.
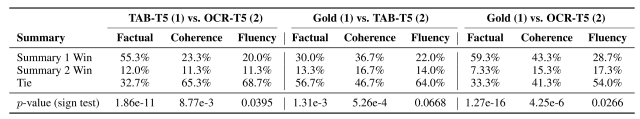
The results show that TAB-T5 is significantly superior to OCR-T5 in all three criteria (especially in Factual).
In addition, the OCR-T5 model, which does not use data tables as input, tends to generate more hallucination errors (shown in red) and factual errors (shown in blue ), as shown in the figure below. (in blue, one value in the chart is misidentified as another value in the data).
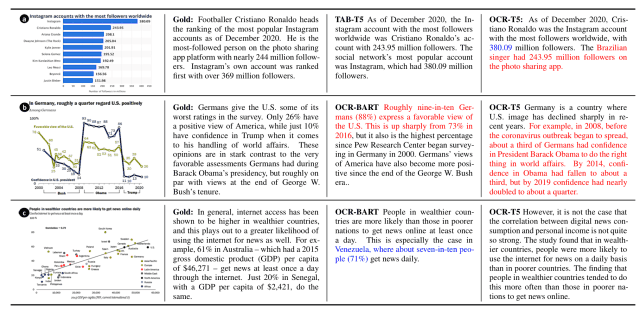
This is likely because it is often impossible to generate factually correct sentences from OCR text, and resolving these issues will be a future challenge.
summary
How was it? In this article, we described Chart-to-text, which builds a significant benchmark for chart summarization and creates baselines using state-of-the-art neural network models.
While the baseline using the dataset created by this paper allowed for adequate chart summarization, especially for large-scale pre-training models, it also revealed some issues specific to the chart summarization task, such as significantly degraded performance when data tables are unavailable, and future developments will be closely watched. Future trends are to be protected.
The details of the dataset presented here and the architecture of the base model can be found in this paper for those interested.


Categories related to this article
