
A New SoTA Model For CQA Tasks That Answers Questions About The Chart Is Now Available!
3 main points
✔️ Proposed Classification-Regression Chart Transformer (CRCT), a new CQA model using Transformer
✔️ To demonstrate the effectiveness of the proposed model, a dataset consisting of a large and diverse set of chartsPlotQA-D is employed
✔️ In experiments using PlotQA-D, CRCT achieves significantly higher accuracy than existing methods
Classification-Regression for Chart Comprehension
written by Matan Levy, Rami Ben-Ari, Dani Lischinski
(Submitted on 11 Jul 2022)
Comments: ECCV 2022
Subjects: Computation Vision and Pattern Recognition(cs.CV)
code:

The images used in this article are from the paper, the introductory slides, or were created based on them.
Introduction
Charts consisting of line graphs, histograms, etc., play a major role in modern communication and can provide various insights by summarizing data in an easily understood visual form and revealing trends and outliers.
However, despite this great practical importance, it has not received much attention in the field of computer vision due to the difficulty of creating data sets and models.
This paper proposes the Classification-Regression Chart Transformer (CRCT), a model that significantly outperforms existing methods, and demonstrates its effectiveness using PlotQA-D, a dataset containing a large and diverse set of charts and text. The paper demonstrates its effectiveness using PlotQA-D, a dataset containing a large and diverse set of charts and text.
Background of Char question answering (CQA) and PlotQAD
Chart question answering (CQA) is a task that takes a chart and a natural language question as input and aims to generate an answer to the question as output. It is fundamentally different from the classification of natural images because it requires analysis of the relationship between the chart and the text to answer the question or infer a numerical value.
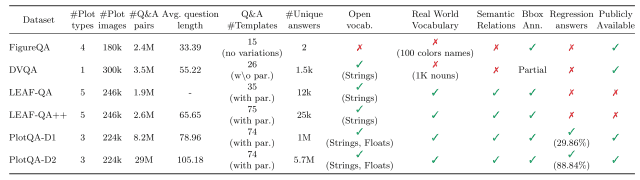
Although several previous studies on CQA had proposed new datasets, Methani et al. noted in their 2020 paper that these datasets were already saturated in terms of chart type and diversity, and to address these issues they created PlotQA-D, a large and diverse dataset of charts and text. To address these issues, they created PlotQA-D, a dataset containing a large and diverse set of charts and text.
As shown in the figure below, PlotQA-D has the largest number of charts and texts compared to the existing data set. (PlotQA-D1 is the initial version and PlotQA-D2 is the extended version including subsets.)
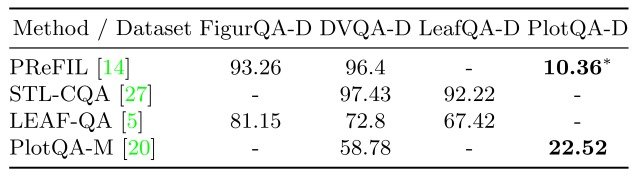
In addition, a comparison of the accuracy of CQA tasks using existing models with multiple data sets, including PlotQA-D, in the figure below shows that only the accuracy of PlotQA-D has declined significantly, as indicated in bold, and it has been pointed out that existing models cannot handle such large data sets. It has been pointed out that existing models cannot cope with such a large data set.
Classification-Regression Chart Transformer (CRCT)
In this paper, a new transformer-based model called the Classification-Regression Chart Transformer (CRCT) is created to address the above issues and achieve state-of-the-art in PlotQA-D. CRCT is a new Transformer-based model called Classification-Regression Chart Transformer (CRCT).
An overview of the CRCT architecture is shown in the figure below.
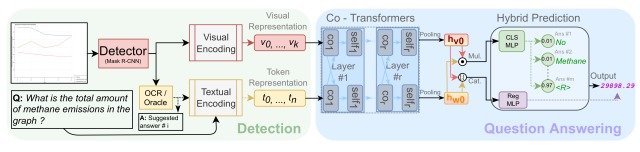
CRCT consists of two stages, DetectionandQuestion Answering. Visual and Token Representations are generated and passed to Question Answering (right side of the figure).
Then, in Question Answering, Co-Transformers transforms visual and textual information into two single feature vectors, hv0, hw0, and outputs classification scores and regression results by a prediction head containing two different MLPs.
This model differs from existing models in four major ways
- In contrast to existing models that only encode questions, this model jointly processes all text elements in the chart
- High generality is made possible by abandoning the common "string matching" and employing Co-Transformers consisting of pre-trained BERTs.
- Employs a novel chart representation learning that fuses multiple inputs from different domains
- Hybrid Prediction, which is not available in existing models, is used to integrate classification and regression into a single model (binary cross entropy loss is used for classification, and L1 loss is used for regression).
These innovations allow CRCT to provide end-to-end learning for all types of questions.
Evaluation
In this paper, several experiments were conducted using PlotQA-D as a benchmark for evaluation against the proposed model, CRCT.
Comparison with existing models
Initially, comparative experiments were conducted usingPlotQA-M (the model proposed together in the paper that proposed PlatQA-D), PReFIL (a representative model in conventional methods), and CRCT-10% (a model pre-trained with 10% training data in CRCT ).
The results are shown in the figure below. (Left: results of verification using regular PlotQA-D, right: results of verification using one-third the size of regular PlotQA-D)
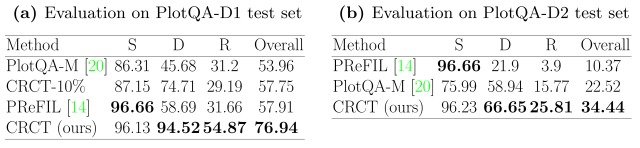
In the table, S refers to Structural (questions about the structure of the chart), D refers to Data Retrieval (questions that retrieve data from the chart), R refers to Reasoning (questions that infer the answer to a question from the entire chart), and Overall refers to the average accuracy of all randomly selected questions. From this experiment, we can see that the proposed model achieves very high accuracy compared to existing models.
Visualization of ATTENTION
Next, we visualized the CRCT ATTENTION using CAPTUM as shown in the figure below.
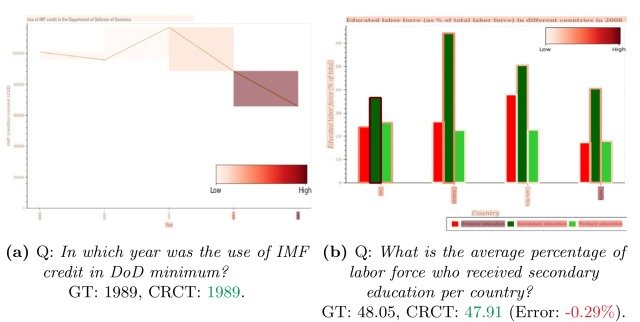
The above figure shows that the CRCTs are color coded to the area corresponding to the minimum value in the plot when asked about the minimum value in the line graph in (a), and to the bar graph in (b) when asked about the mean value of a category (secondary education) in the bar graph in ( c). When asked about the average value of a category (secondary education) in bar chart (b), the CRCT directs its attention to the bar chart of the corresponding category, respectively.
summary
How was it? In this article, we proposed the Classification-Regression Chart Transformer (CRCT), a model that significantly outperforms existing methods, and demonstrated its effectiveness using PlotQA-D, a data set containing a large and diverse set of charts and text. The paper demonstrated the effectiveness of the CRCT using PlotQA-D, a dataset containing a large and diverse set of charts and text.
The proposed model in this paper shows excellent accuracy on the PlotQA-D data set, which was not handled by existing models. The model is very practical for the CQA task.
On the other hand, there are still some issues, such as the color of graphs differing between training and test data, and a decrease in accuracy when non-linear graphs are used as input. We are very much looking forward to future developments. The details of the architecture and generated text of the model presented here can be found in this paper, and those interested should refer to it.


Categories related to this article