
OpenCQA, The Task Of Answering Open-ended Questions About Graphs With Text, Is Here!
3 main points
✔️ Proposed OpenCQA, a new task to answer open-ended questions about graphs with descriptive text
✔️ Created a benchmark dataset for OpenCQA consisting of open-ended questions and descriptive answers about them
✔️ Validated using state-of-the-art models as a baseline and found that while the model used was able to generate fluent and consistent explanations, it had difficulty performing complex logical reasoning
OpenCQA: Open-ended Question Answering with Charts
written by Shankar Kantharaj, Xuan Long Do, Rixie Tiffany Ko Leong, Jia Qing Tan, Enamul Hoque, Shafiq Joty
(Submitted on 12 Oct 2022)
Comments: Published on arxiv.
Subjects: Machine Learning (cs.LG); Computation and Language (cs.CL)
code:

The images used in this article are from the paper, the introductory slides, or were created based on them.
Introduction.
Using data visualization techniques such as bar charts and line graphs to discover and explain important insights in data to others is a necessary process for many tasks, but it can be labor-intensive and time-consuming.
Chart Question Answering (CQA) is a task designed to solve these problems by taking a graph and a natural language question as input and generating an answer to the question as output.
CQA is a task that has received a lot of attention in recent years, but the problem is that existing datasets focus only on closed-ended questions where the answer is a word or phrase (i.e., where the answer is a choice, such as "Yes/No" or "A/B" ). The problem was that they only focused on closed-ended questions (questions where the answer was "yes/no" or "A/B").
In this paper, we propose a new task, OpenCQA, which aims to answer open-ended questions about graphs with descriptive text to solve this problem and demonstrate its effectiveness by creating and validating a benchmark data set as a baseline for this task. The paper will discuss the paper that demonstrates the effectiveness of OpenCQA by creating and validating a benchmark dataset baseline for this task.
Data Collection & Annotation
The creation of datasets consisting of open-ended questions and annotator-written response statements has not been done previously for several reasons, including the fact that few data sources with graphs and associated textual descriptions are publicly available.
Therefore, for this paper, we decided to use graphs from Pew Research (pewresearch.org), where professional writers use various graphs and summaries to write articles on market research, public opinion, and social issues.
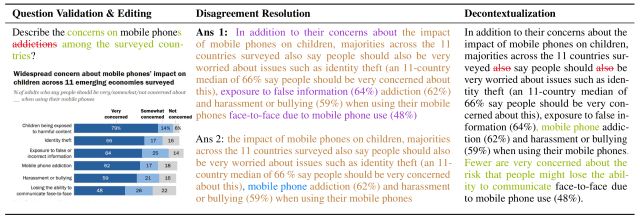
For the 9285 graph-summary pairs scraped from approximately 4000 articles on this website, a total of 7724 sample data sets were created by adding (green, purple, blue, and brown text in the figure) or eliminating (red text in the figure) new summary text, as shown in the process below The total number of sample data was 7724.
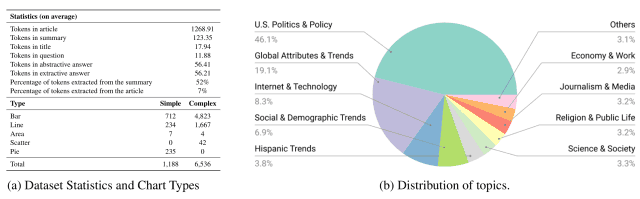
As can be seen in Figure (a) below, the dataset created includes various types of graphs, such as bar, line, and pie charts, and covers a diverse range of topics, including politics, economics, and technology, as can be seen in Figure (b) below.
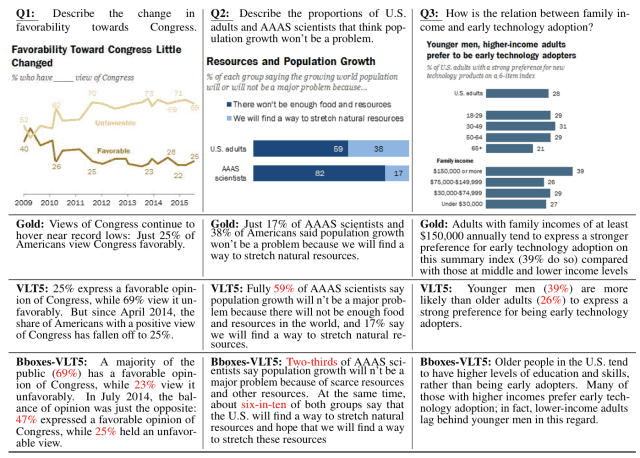
OpenCQA task
The OpenCQA proposed in this paper is a task that outputs the text that serves as the answer to an input question about a graph, and specifically, there are four question types as shown in the figure below.
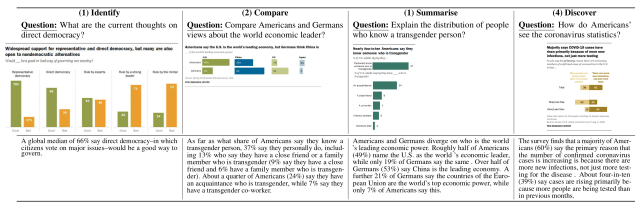
- Identify: Questions about a specific target for a group of bars
- Compare: A question that compares two specific targets on a graph.
- Summarize: The question asks you to summarize the statistical distribution on a graph.
- Discover: Questions that do not specify a specific task, but require inferences across the entire graph
Baseline Models
In this paper, the following seven existing models were used as a baseline for the data set created.
- BERTQA: Performance-enhanced model for the original BERT model by using directed coattention layers
- ELECTRA: A model employing self-supervised representational learning that emphasizes computational efficiency
- GPT-2: A Transformer-based text generation model that sequentially predicts the next word based on words in a given text.
- BART: A model that has been shown to achieve state-of-the-art performance in text generation tasks such as summarization using a standard encoder-decoder transformer architecture
- T5: A unified encoder-decoder transformer model for converting linguistic tasks into a text-to-text format
- VLT5: T5-based framework that unifies Vision-Language tasks as text generation subject to multimodal input
- CODR: Model proposing a document-grounded generation task where the model enhances text generation with the information provided by the document
For these models, we conducted validation under the following three conditions
- Setup1: With Article Provided ( = the full text of the graph and the accompanying article are given as input)
- Setup2: With Summary Provided ( = only the graph and the summary of the related article are given as input)
- Setup3: Without Summary Provided ( = only the graph is given as input)
Given the inputs in each condition and questions about the graph, the baseline model generates answers to the questions.
Evaluation
In this paper, two types of validation were conducted: automatic evaluation by evaluation indicators and human evaluation of the quality of responses.
Automatic Evaluation
The automated evaluation was validated against a dataset created using six evaluation metrics: BLEU, ROUGE, CIDEr, BLEURT, Content Selection (CS), and BERT Score.
Verification results under Setup1-3 conditions are shown in the figure below.
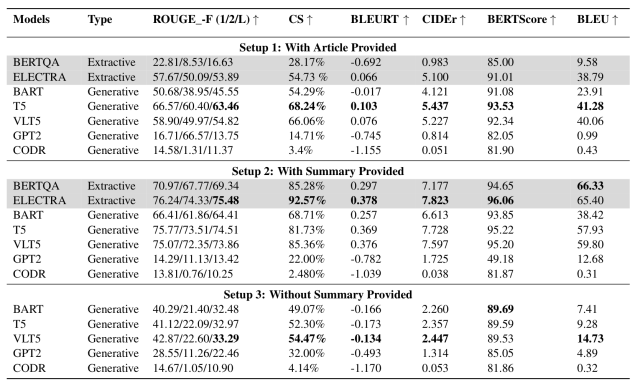
From this table, we found the following
- Significantly better performance when only the relevant summary is given (Setup 2) compared to when the full text of the article is given (Setup 1)
- In addition, the summary case (Setup 2) shows significantly better performance than the graph-only case (Setup 3).
- This is likely because if no summary is given, the model has no textual reference to generate an answer to the question
- When no summary is given, VLT5 achieves the best results for most indicators
- This is likely because VLT5 uses both graph image and text features to generate responses
These results show that for most models, the best performance is achieved when given a "graph + associated summary".
Human Evaluation
To further assess the quality of the responses generated by the model, a comparative validation was performed by three native English-speaking annotators on 150 graphs randomly selected from the OpenCQA dataset.
VLT5, the best-performing model in the automatic evaluation, is used as the comparison model and is denoted as VLT5-S and VLT5 with and without summary text, respectively.
Annotators evaluated the model-generated responses based on three criteria employed in existing studies.
- Factual correctness: How well the generated text contains information that the graph can read.
- Relevance: How well is the text related to the question being generated?
- Fluency: How much of the generated text contains formatting and capitalization errors
Based on these three criteria, the annotators rated the products on a 5-point scale from 1 (worst) to 5 (best).
The results are shown in the figure below. (Correct answers are marked as Gold.)
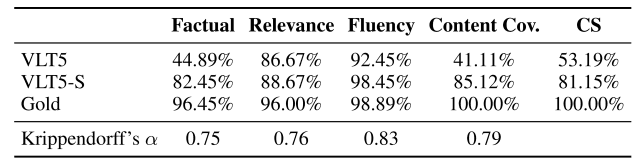
The table shows that VLT5-S (with summary statement) is rated higher than VLT5 (without summary statement) in each indicator.
On the other hand, the VLT5 model received high marks for Relevance and Fluency, but there is room for improvement in Factual and CS. (The red text in the figure below shows the areas of error.)
Thus, future work is needed to improve the problem that the accuracy of the generated text is significantly reduced when only graphs are used as input.
summary
How was it? In this article, we described a paper that proposed OpenCQA, a new task to answer open-ended questions about graphs with descriptive text, and created a large data set and baseline for this task.
The author is very much looking forward to future progress, as he states that although this baseline achieved excellent results with existing evaluation metrics, the nature of the task of generating more human-like responses requires further research to build better evaluation metrics that correlate with human judgment.
The details of the dataset and baseline model architecture presented in this paper can be found in this paper for those who are interested.


Categories related to this article