Unsupervised Hyperbolic Distance Learning
3 main points
✔️ We proposed an unsupervised hyperbolic distance learning that can extract the hierarchical structure of the data better than before.
✔️ Introduced a new loss function that considers the similarity more finely instead of dichotomizing the hierarchical similarity.
✔️ The model proposed in this paper recorded SOTA on three benchmarks of clustering.
Unsupervised Hyperbolic Metric Learning
written by Jiexi Yan, Lei Luo, Cheng Deng, Heng Huang
Comments: CVPR
Subjects: Computer Vision and Pattern Recognition (cs.CV)
The images used in this article are from the paper, the introductory slides, or were created based on them.
first of all
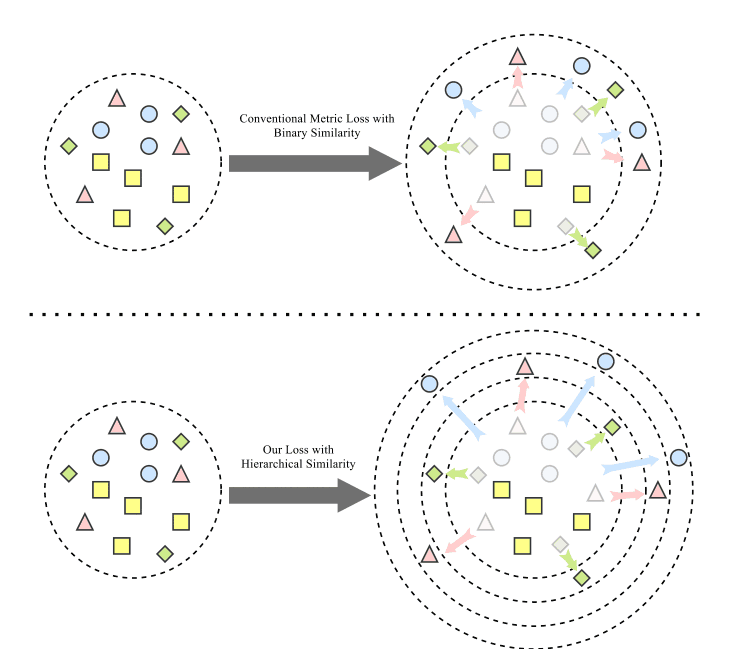
Distance learning, which learns similar distances, is important and has been studied in various areas of computer vision. In particular, deep distance learning uses deep learning learns features to place positive samples closer to the anchor and negative samples farther away from the anchor. However, since it is difficult to obtain a large amount of label data in the real world, unsupervised methods that learn the intrinsic structure of the data are attracting attention. Conventional methods dichotomize the data into positive and negative, but in the real world, some of the same negative samples are close to the anchor and some are far away, so a more hierarchical classification is more effective for learning features. It has also been suggested that obtaining features in Euclidean space does not always capture the structure of the data. Therefore, in this paper, we proposed an unsupervised hyperbolic distance learning method to extract intrinsic information from unlabeled data. First, we incorporate the data from the usual Euclidean space into the hyperbolic space. Then, hierarchical clustering is performed to obtain pseudo-labels. Furthermore, we introduced a new loss function that takes hierarchical similarity into account.
technique
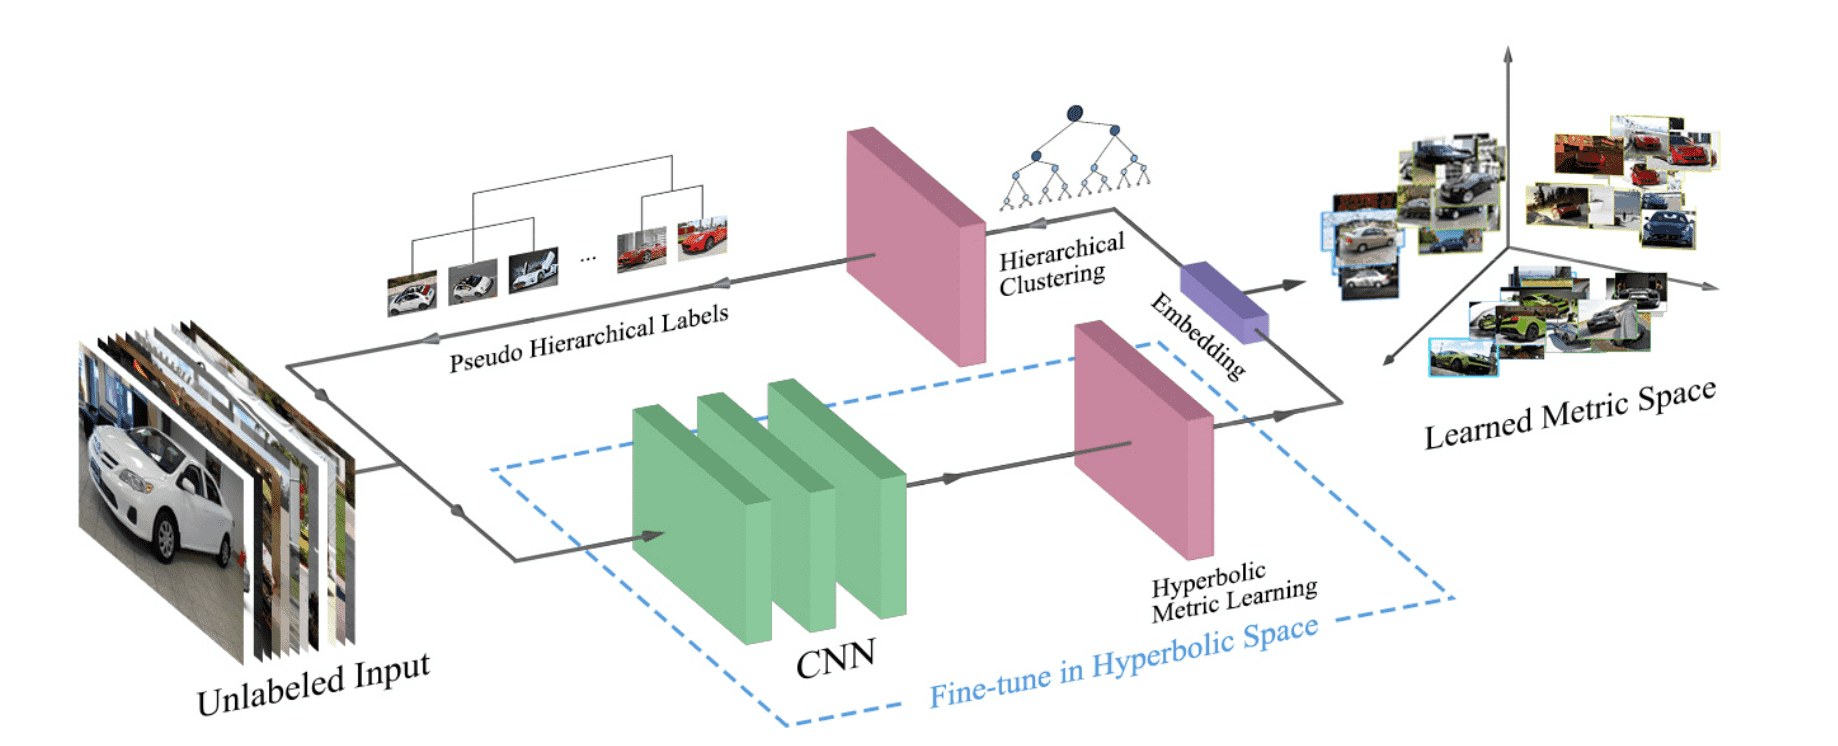
The model is outlined in the figure below. Given a dataset ${\cal D}=\{{\bf x}_1,{\bf x}_2,\cdots{\bf x}_n\}$, the feature ${\cal Z}=\{{\bf z}_i=f({\bf x}_i|\theta)\}_{i=1}^n$ is obtained. Then, cluster them with the hierarchical clustering module. From the clustering result ${\cal H}$, calculate the similarity ${\cal S}=\{s_{ij}\}_{i,j=1}^n$. ${\cal S}$ as the teacher data to fine-tune the hyperbolic distance learning module.
hyperbolic distance learning
In this paper we introduce hyperbolic geometry to capture hierarchical structures. In particular, we consider a Poincaré sphere model of hyperbolic space corresponding to a Riemannian manifold with a particular lightweight tensor. The Poincaré sphere model is defined by the manifold ${\mathbb D}_\tau^d=\{{\bf x}\in {\mathbb R}^d: \tau||{|\bf x}||<1,\tau\geq0\}$ is defined by where $\tau$ is the curvature of the Poincaré sphere. In this model, the distance between two points ${\bf z}_i,{\bf z}_j\in {\mathbb D}_\tau^d$ is
$$d_{\mathbb D}({\bf z}_i, {\bf z}_j)={\rm cosh}^{-1}\left(1+2\frac{||{\bf z}_i-{\bf z}_j||^2}{(1-||{\bf z}_i||^2)(1-||{\bf z}_j||^2)}\right)$$
Then, the hyperbolic network layer is added to the final layer. Then, the hyperbolic network layer is added to the final layer, and the "exp" mapping projects the input features of ${\mathbb R}^n$ to the hyperbolic manifold of ${\mathbb D}_\tau^n$.
$${\bf z}={\rm exp}^\tau({\bf x}):={\rm tanh}({\sqrt \tau}||{\bf x}||)\frac{{\bf x}}{{\sqrt \tau}||{\bf x}||}$$
hierarchical similarity
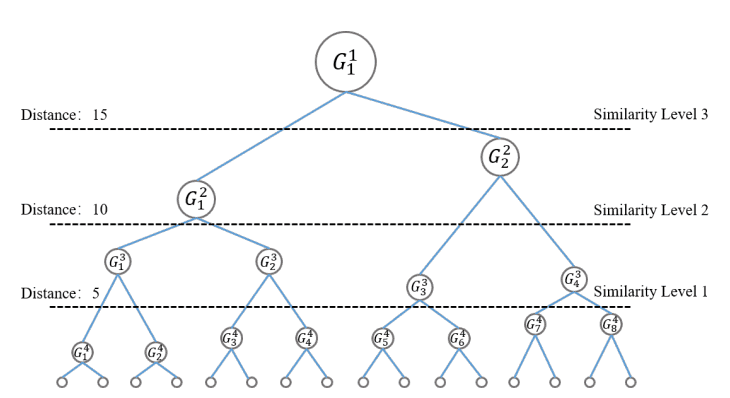
To obtain better information content, we consider a tree structure consisting of several subclusters as shown in the figure below. The distance between samples in different subclusters is
$$d_{ab}=\frac{1}{n_an_b}\sum_{{\bf z}_i^a\in C_a, {\bf z}_j^b\in C_b}||{\bf z}_i^a-{\bf z}_j^b||$$
We define ${\bf z}_i^a, {\bf z}_j^b$ to be the subclusters $C_a, C_b$. where ${\bf z}_i^a, {\bf z}_j^b$ are the samples of subclusters $C_a, C_b$ and $n_a, n_b$ are the number of samples of $C_a, C_b$. The similarity level is calculated according to the size of $D_{ab}$ and the threshold $\delta$. In the example below, these are the three similarity levels obtained when $\delta=\{5,10,15\}$. Finally, the sample ${\bf z}_i^a, {\bf z}_j^b$ as the similarity level between
$$s_{ij}=L_k, \ L_k \in \{1,2,\cdots,K\}$$
defined.
loss function
To make effective use of the hierarchical similarity information, given a sample $\{{\bf z}_i, {\bf z}_j, {\bf z}_l\}in {\cal S}$ in hyperbolic space, we define the loss function as follows.
$${\cal L}(i,j,l)=\left({\log}\frac{||{\bf z}_i-{\bf z}_j||}{||{\bf z}_i-{\bf z}_l||}-{\log}\Omega^{s_{ij}-s_{il}}\right)^2$$
However, $\Omega$ is a hyperparameter that adjusts the contribution of the hierarchical similarity. The first term is the log ratio between samples and the second term is the log ratio of the corresponding hierarchical similarity. By introducing this, negative samples can be separated according to their similarity as shown in the figure below.
result
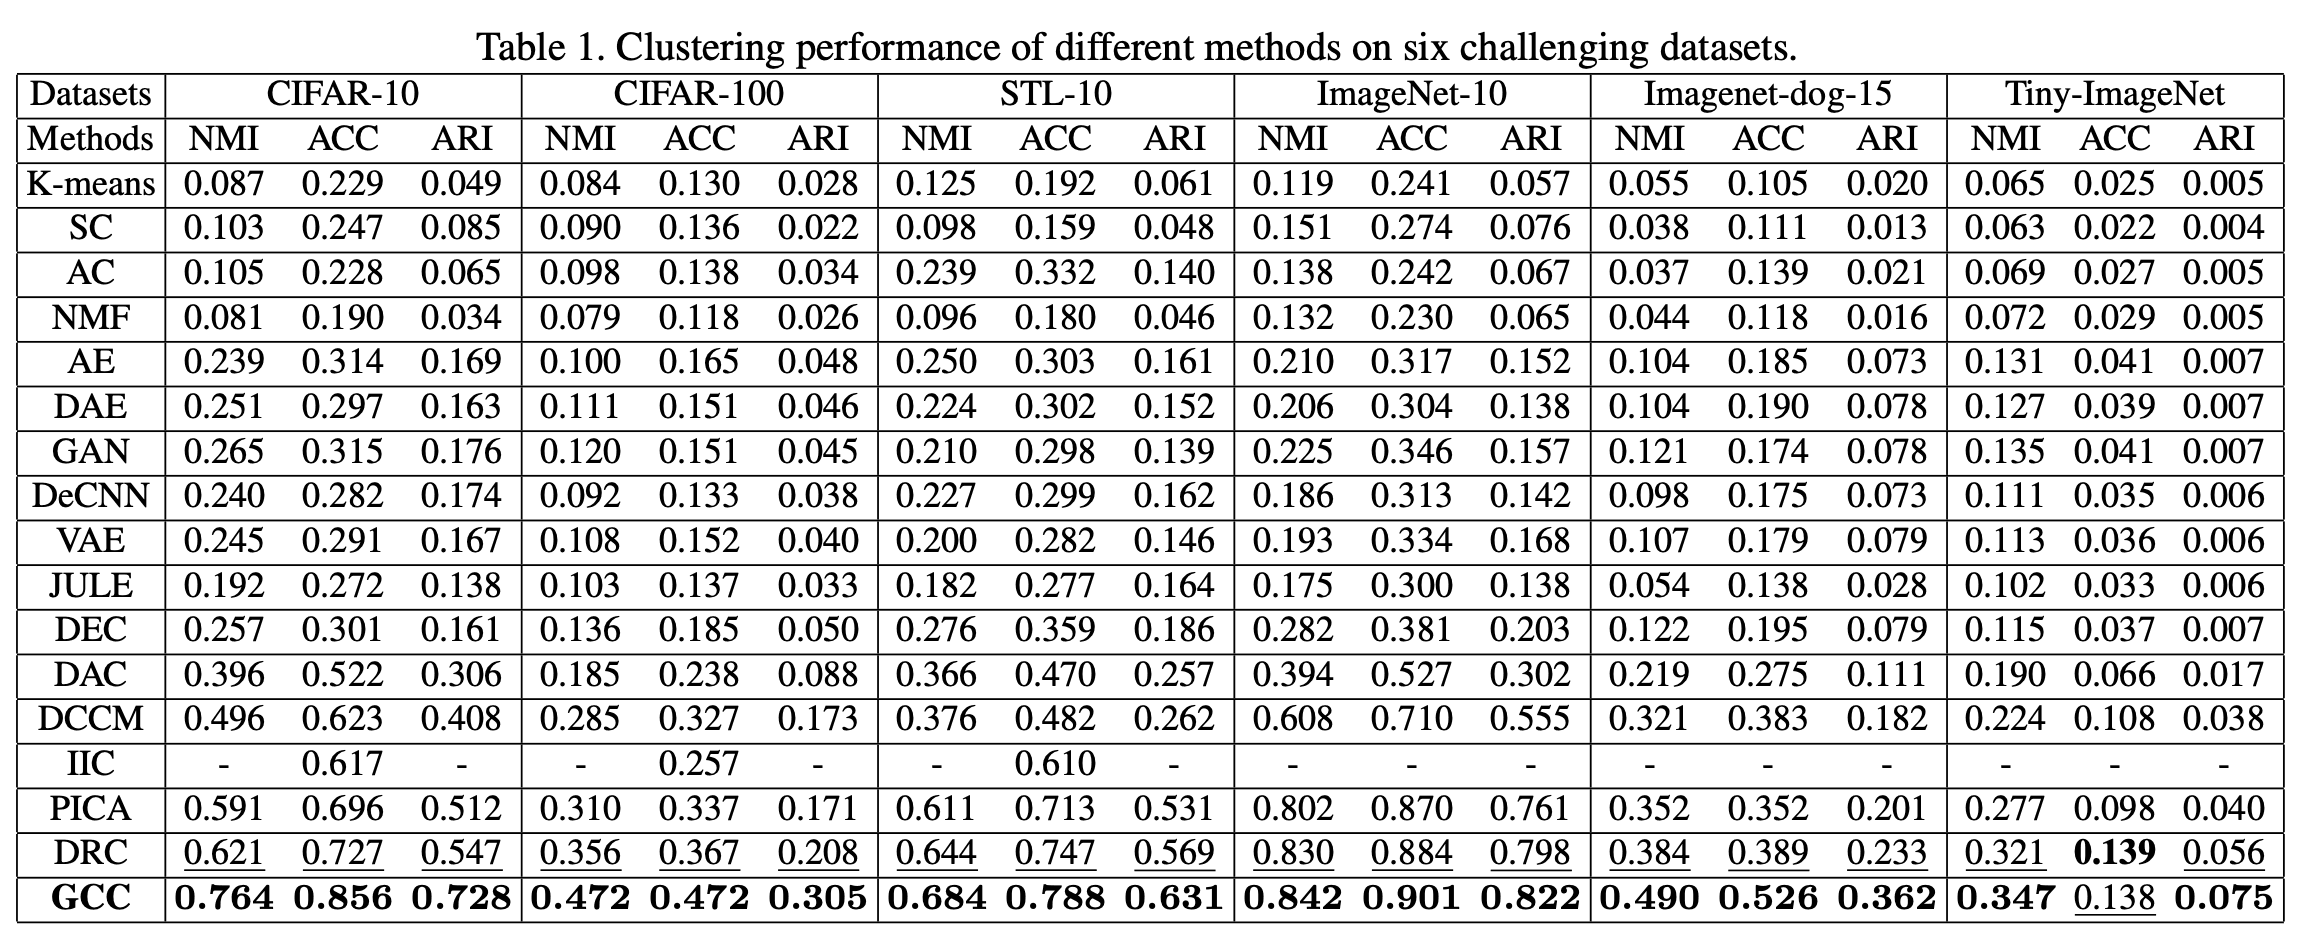
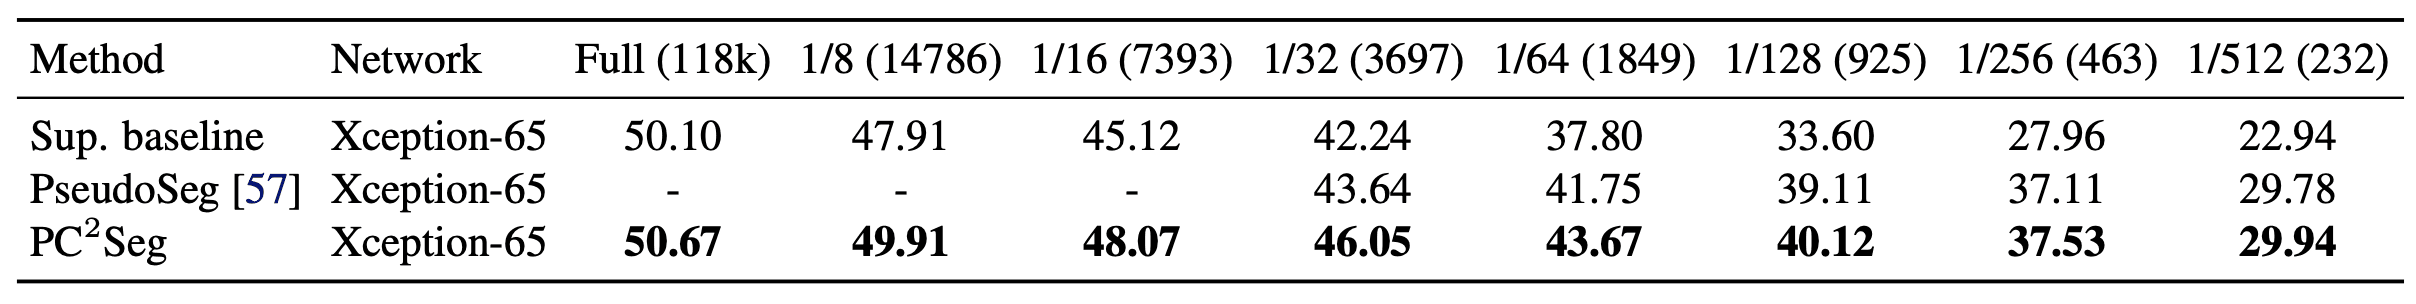
To compare with the previous models, we performed the image retrieval task with an unsupervised method using a public dataset. The results are shown in the table below. Where SOP(Stanford Online Products), CARS196, and CUB-200-2011 are public datasets and R@K is the recall per hierarchy level K. From the table, it can be seen that our method has the best performance on all datasets. This shows that the method can extract more amount of information by using hierarchical similarity.
summary
In this paper, we proposed unsupervised hyperbolic distance learning. First, we considered the hierarchical similarity and clustered them in hyperbolic space. Furthermore, we introduced a new loss function that takes them into account. Compared with the previous models, our method recorded SOTA on several benchmarks.


Categories related to this article


![CLAP] Contrastive Le](https://aisholar.s3.ap-northeast-1.amazonaws.com/media/December2023/clap_2_-520x300.png)
![LP-MusicCaps] Automa](https://aisholar.s3.ap-northeast-1.amazonaws.com/media/November2023/lp-musiccaps-520x300.png)
![MuLan] Multimodal Mu](https://aisholar.s3.ap-northeast-1.amazonaws.com/media/October2023/mulan-520x300.png)