Group-CAM: Is Grad-CAM Obsolete? Decision Basis Methods In State-of-the-Art CNNs
3 main points
✔️ Includes a mechanism to eliminate noise in feature maps
✔️ Enables fast saliency map inference
✔️ Achieves SOTA despite the low computational cost in some experiments
Group-CAM: Group Score-Weighted Visual Explanations for Deep Convolutional Networks
written by Qinglong Zhang, Lu Rao, Yubin Yang
(Submitted on 25 Mar 2021 (v1), last revised 19 Jun 2021 (this version, v4))
Comments: Published on arxiv.
Subjects: Computer Vision and Pattern Recognition (cs.CV); Artificial Intelligence (cs.AI)
code:

The images used in this article are from the paper, the introductory slides, or were created based on them.
first of all
In recent years, deep learning-based image recognition models have been rapidly adopted in automated driving and medical diagnosis. However, many people are hesitant to introduce them because they are black-box methods and the basis of the decision is unknown. However, many people are hesitant to introduce the deep learning-based image recognition model because of the concern that it may cause serious problems.
To address these concerns technology to explain the basis for decisions in deep learning models, called Explainable AI (XAI) is becoming more and more important in recent years.
XAI, which is widely used in computer vision, is a saliency map. This is a heat map that highlights the pixels on which a decision is based according to their importance. For example, suppose that the following dog and cat pictures are input to a trained image classification model and it identifies them as dogs. In this case, The saliency map would be The more evidence and important parts of the image are in red. In this case, we can see that the area around the dog's mouth is the basis of the image.

The methods in this field can be roughly classified into two types, and Group-CAM introduced here is a method that overcomes the shortcomings of each.
- Region-based Saliency Methods
- Activation-based Saliency Methods
Region-based Saliency Methods
This family of methods takes a target image and applies a mask to a trained model to determine the importance of pixels and superpixels.RISE uses a Monte Carlo method to determine the importance of each pixel in thousands of randomly generated masks. Another method is Score-CAM and XRAI are available.
However, there is a problem of heavy computational cost because thousands of masks need to be generated and inferred. for inference RISE and XRAI, It is reported in this paper that it takes about 40 seconds to infer one
Activation-based Saliency Methods
This line of methods infers a saliency map based on the feature maps in the backbone of the model. The feature map of the last layer is often used. The flow of inference is to determine the weights of each channel of the feature map, weight them, add them in the direction of the channel, enlarge them, and combine them with the input image. In this type of research, how to assign weights is often the main point of discussion.
A well-known method is Grad-CAM. The weights are determined by applying Global Average Pooling (GAP) to the gradients about the feature maps in the final layer.
However, there is a problem that these weights do not correctly evaluate the importance of the feature map, and that the feature map itself contains noise and includes unimportant parts.

Thesis Outline
Group-CAM, which we introduce here, is a method that solves the following problems mentioned above.
- The problem of the heavy computational cost of region-based methods
- The problem of including noise in activation-based methods
The overall architecture is as follows
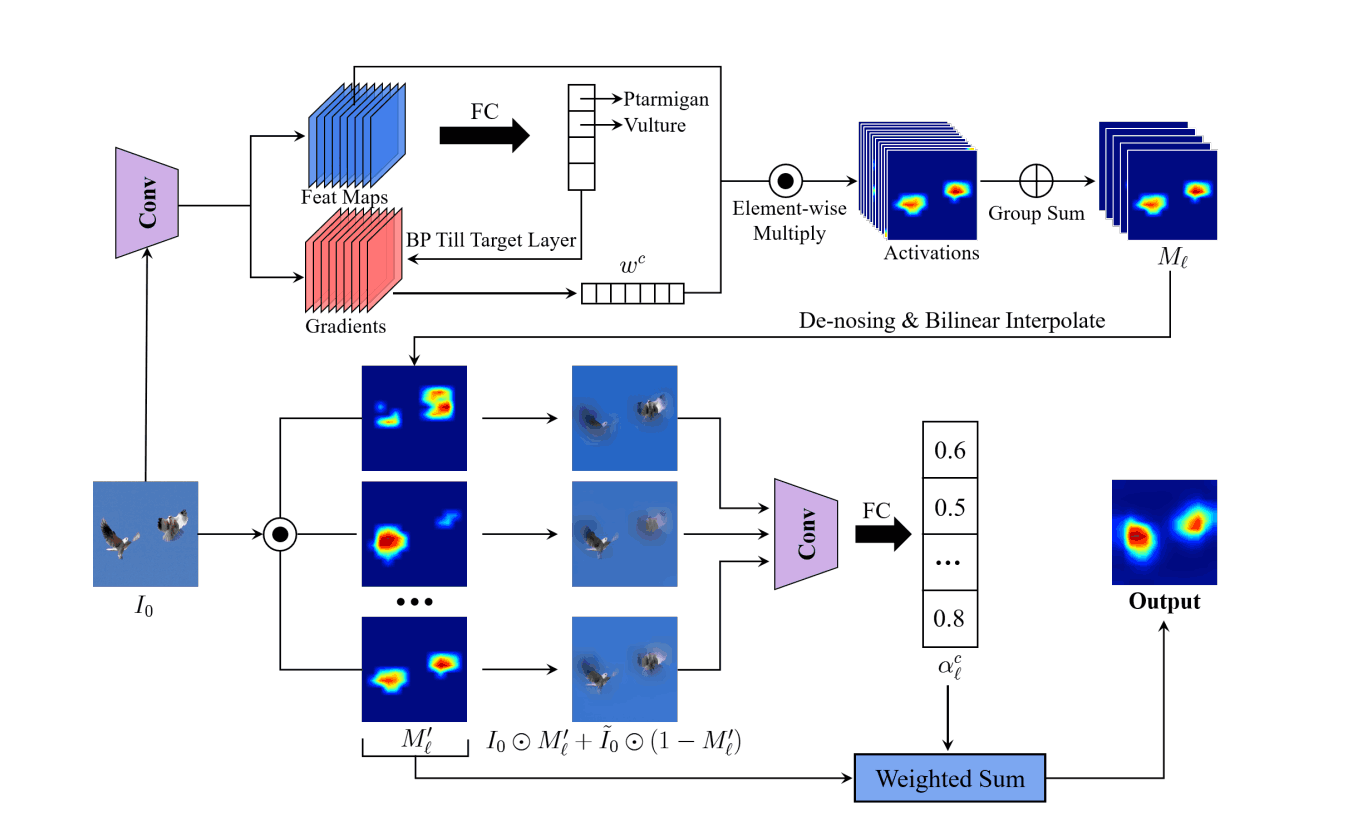
There are three phases of reasoning.
- Determine the weights of the feature map
- Feature map denoising
- Determine weights of grouped feature maps and create saliency maps
Step1. determine the weight of the feature map
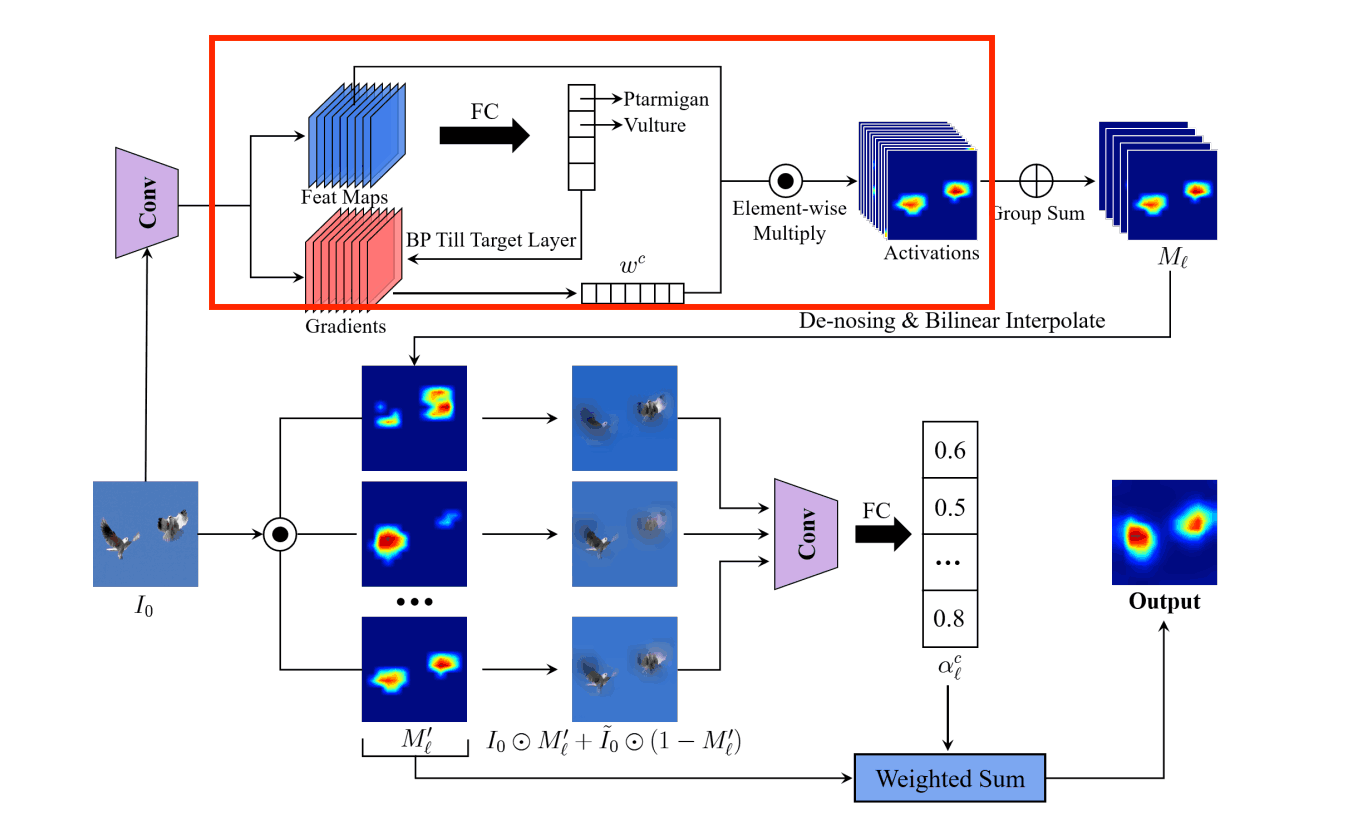
What we are doing is the same as Grad-CAM is the same as First of all, the image for which the basis of judgment is desired is input to the trained model, and the feature map in the convolutional layer is kept. Then, we calculate the gradient of the convolutional layer for the classification result using the error backpropagation method.
Global Average Pooling (GAP) is applied to this gradient to calculate the weights in the number of channel dimensions. wkc, the weight of channel c in the kth convolution layer, is expressed in the formula as
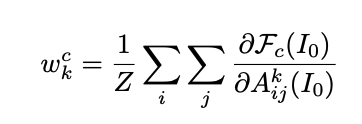
Input image: I 0
of the kth convolutional layer feature map. Aij k
Fc ( I0 ): predicted probability of class c
i,j: Height and width
Z: the number of pixels in Ak the number of pixels contained in
Step2. denoising of the feature map
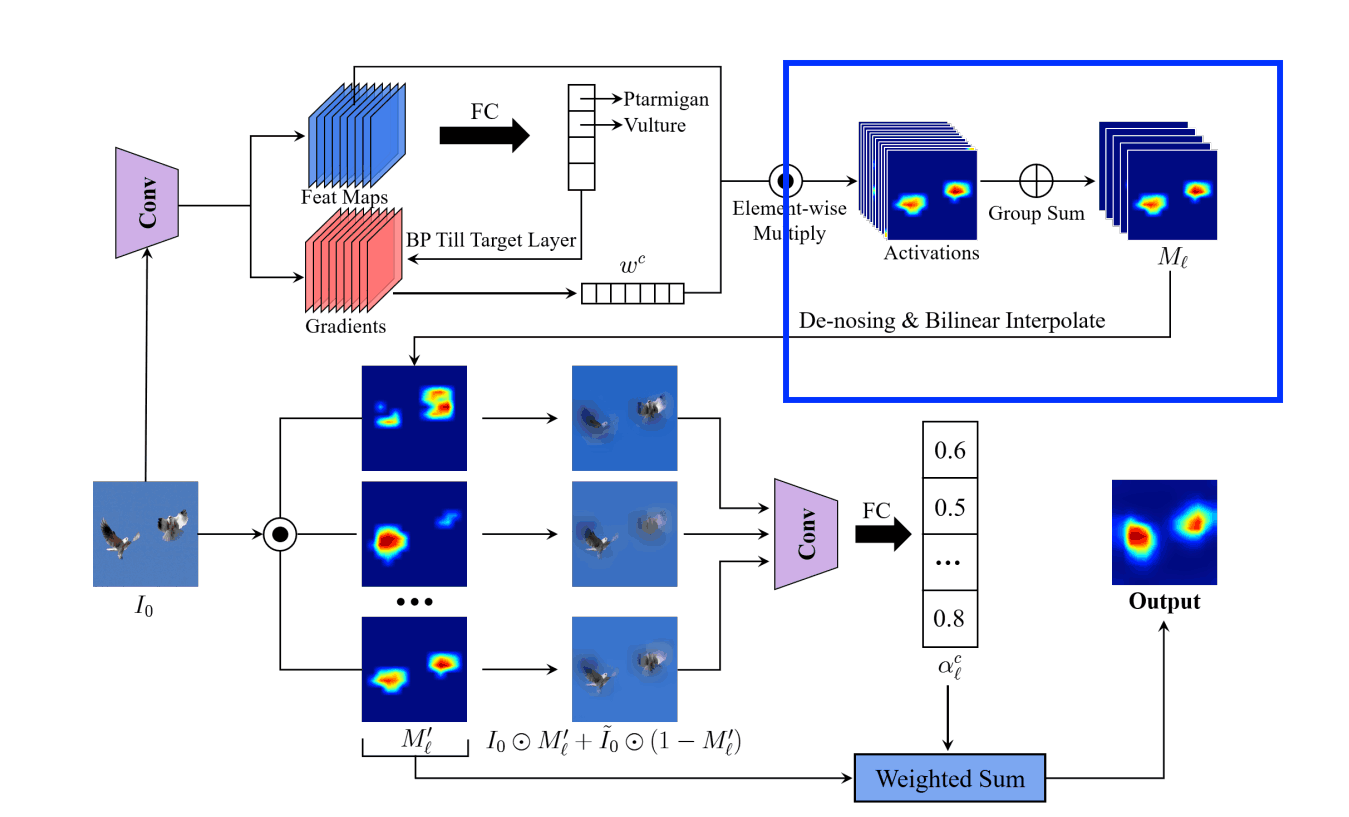
There are two things to do here.
- Divide the feature maps obtained in Step 1 into G groups and summarize them into G feature maps.
- Remove noise and normalize the summarized feature map
Divide the feature maps obtained in Step 1 into G groups and summarize them into G feature maps.
The way the groups are divided is ResNexT adjacent feature maps are grouped in the same way as
The summarized feature Ml is represented as follows
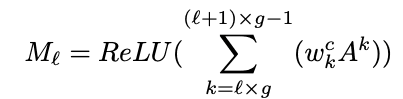
K: number of channels
 g=K/G: number of channels of feature maps in the group
Removing noise from summarized feature maps
denoising the pixels in the lower θ% to zero.
 The denoising Φ applied to the mij pixels of Ml is represented as follows
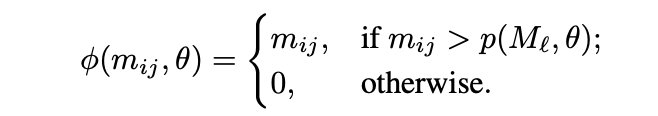
p( Ml,θ): upper bound of pixels in lower θ%.
The image is then normalized to be in the range [0,1] and scaled to the size of the input image by bilinear interpolation. 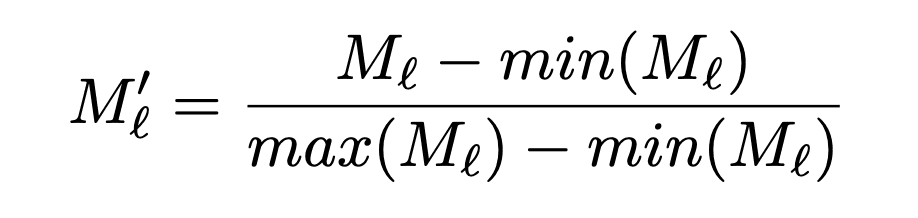
Step3. determine the weights of the grouped feature maps and create the saliency map
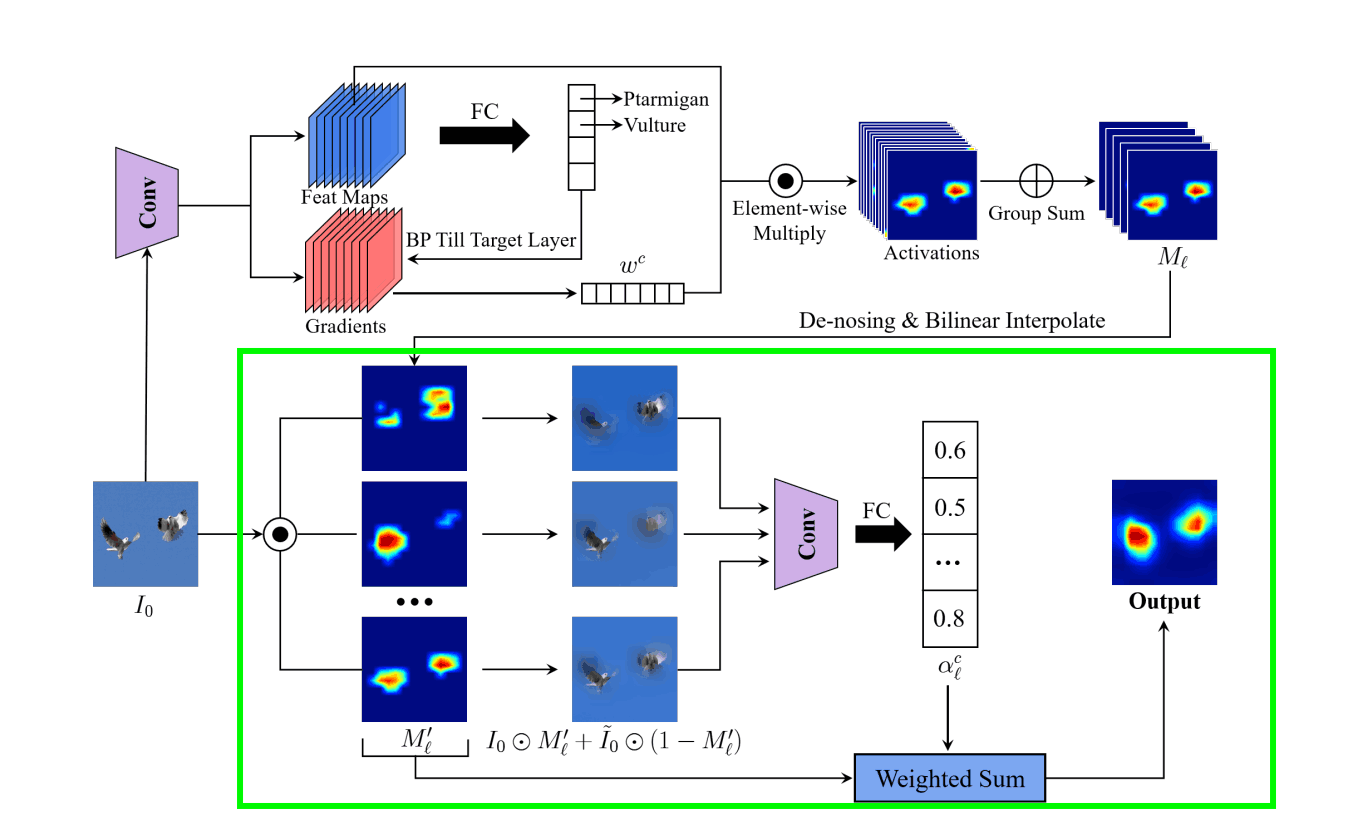
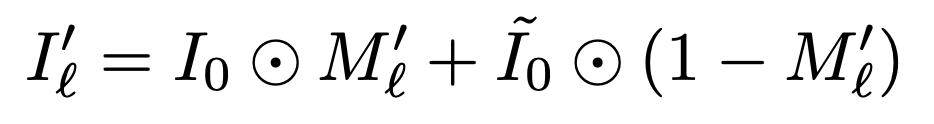
We apply the normalized feature map Ml ' as a mask to the original input image Io and also add the Gaussian blurred ĩo. The reason for adding this is that the masked input image alone may have hostile effects.
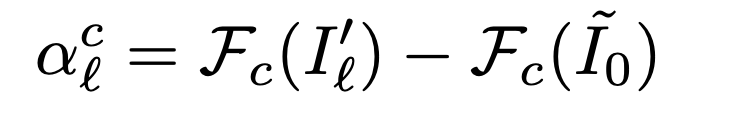
What we do from here is the same as RISE. We infer the predicted probability in class c of the masked input image for G and take the difference between the predicted probability in class c when ĩo is input.
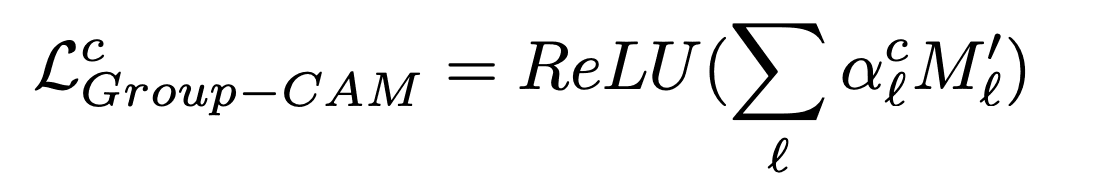
Then, the lth summarized feature map is weighted by alc to generate a heat map.
experiment
Visualization of Class Discrimination
The middle and right images show the rationale for the decision when torchvision's learned model VGG19 identified the bull mastiff (dog) with 46.06% confidence and the tiger cat with 0.39% confidence. As you can see, we can explain the rationale despite the low confidence level of the tiger cat.
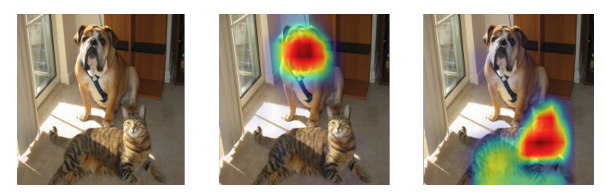
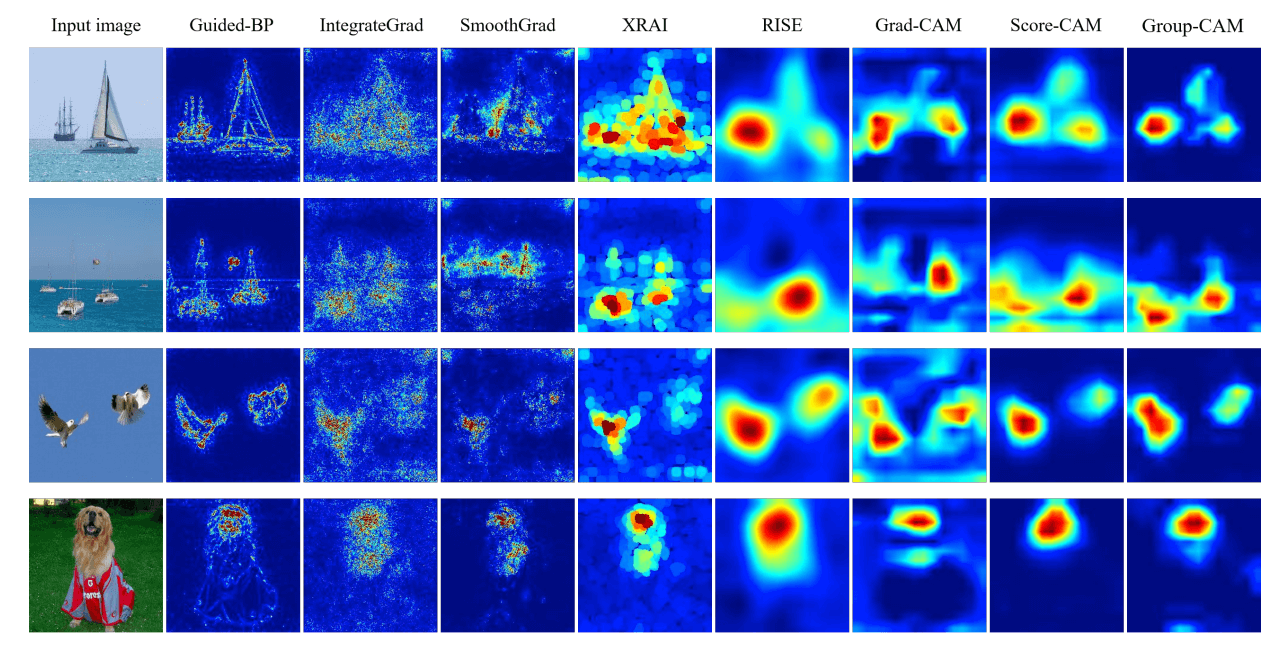
The figure below compares Group-CAM with other methods that have achieved SOTA and show that Group-CAM has less noise than the other methods.
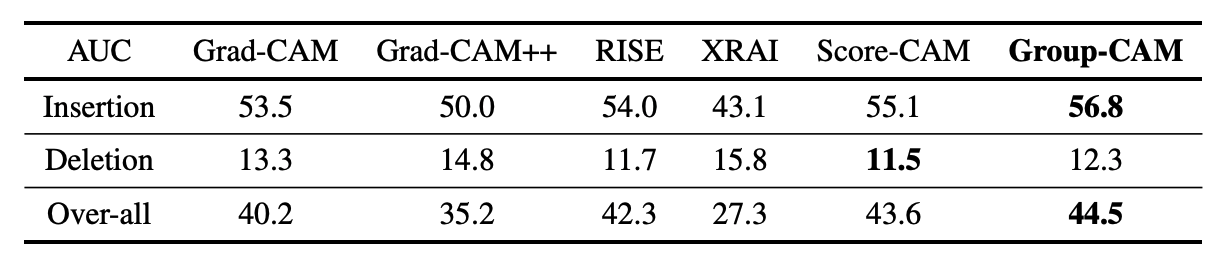
Deletion and insertion tests
RISE We show the results of the Deletation and Insertion test proposed in
The reason behind the development of this method is that XAI in CNNs is considered to perform well if the most important part of the saliency map is located on the bounding box annotated by a human, but this is not always true since CNNs may be discriminating based on the background. However, this is not always the case because CNNs may take into account the background.
In the deletion test, the area under the curve (AUC) is used as a measure of the predicted probability of a class on the vertical axis.
In the insertion test, we add the original image to the blurred image by 3.6% according to the importance of the saliency map and use the area of the graph (AUC: Area Under Curve), where the vertical axis is the predicted probability of the class, as the index.
For the deletion test, a lower AUC is better because a sudden drop in the prediction probability is considered to be an important basis for the decision, and for the insertion test, a higher AUC is better because a sudden increase in the prediction probability is considered to be an important basis for the decision.
As you can see, Group-CAM has the best overall results. The overall rating value is calculated as AUC(Insertion) - AUC(Deletion).
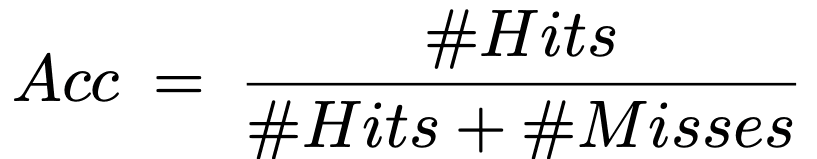
Detection evaluation
The evaluation is performed using the trained model Resnet-50 on the dataset MS COCO2017 val2017. The evaluation is done by treating any salient pixel on the bounding box of an object as a Hit, and the performance value is the average value for all categories.
In our experiments, the results are 0.8% higher than Grad-CAM. 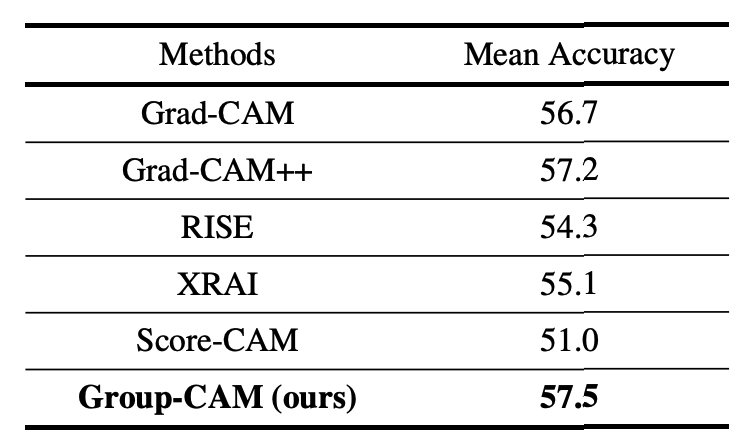
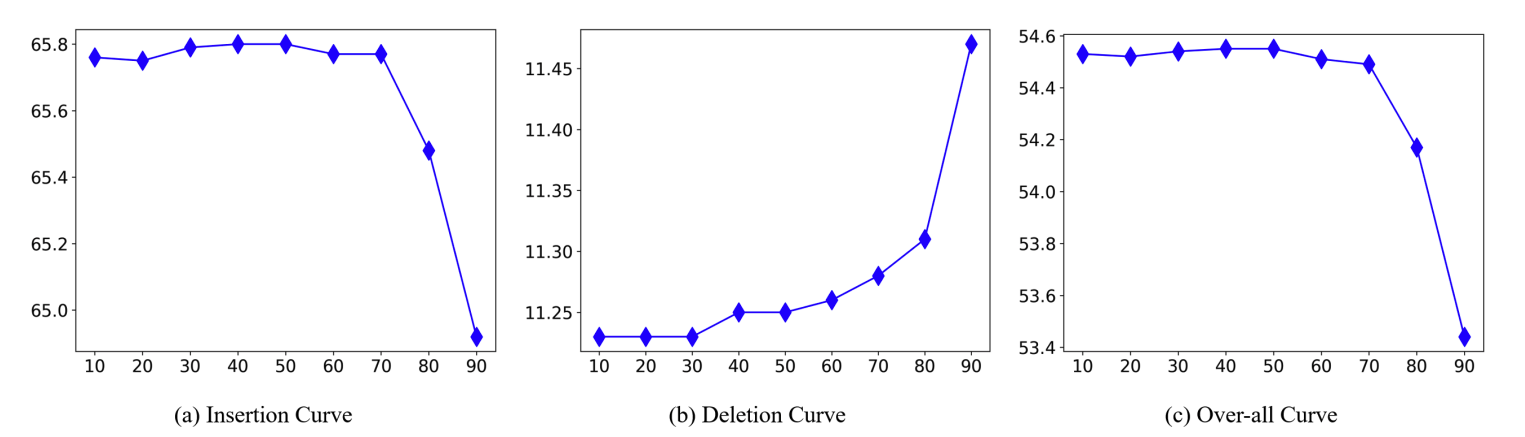
The noise rejection hyperparameter θ
It was found that the AUC was constant when θ was less than 70 and suddenly decreased when θ was greater than 70.
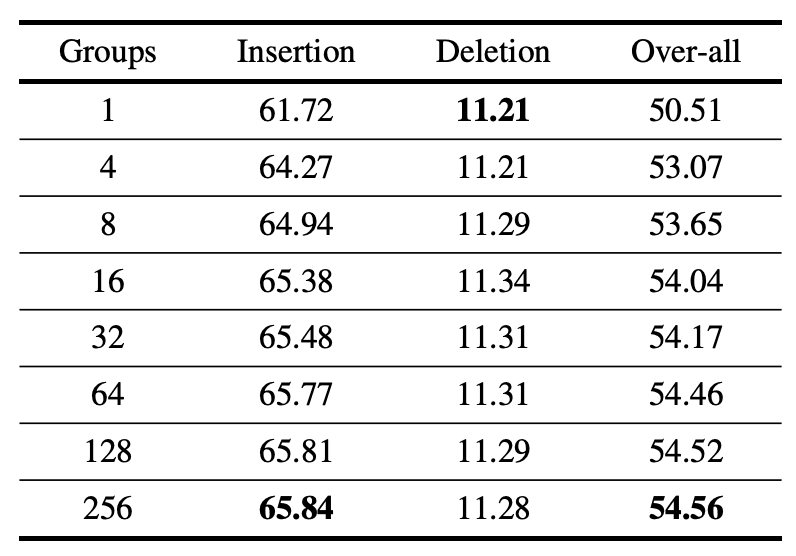
Number of groups G
We found that the more G is increased, the higher the overall AUC value is. However, increasing G raises the computational cost, so we use 32 in our experiments.
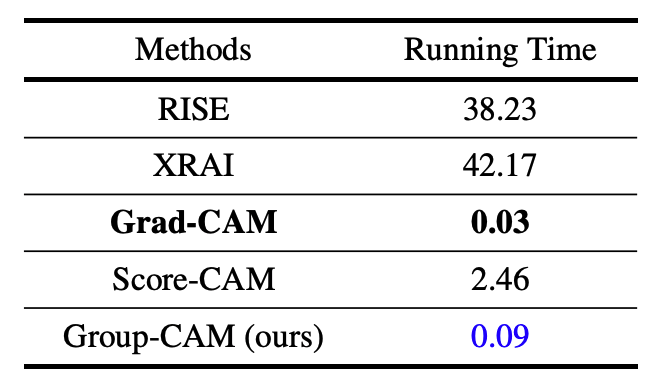
execution time
Here are the results on the NVIDIA 2080Ti GPU, showing that Grad-CAM and Group-CAM can be run as fast as 0.1 seconds or less.
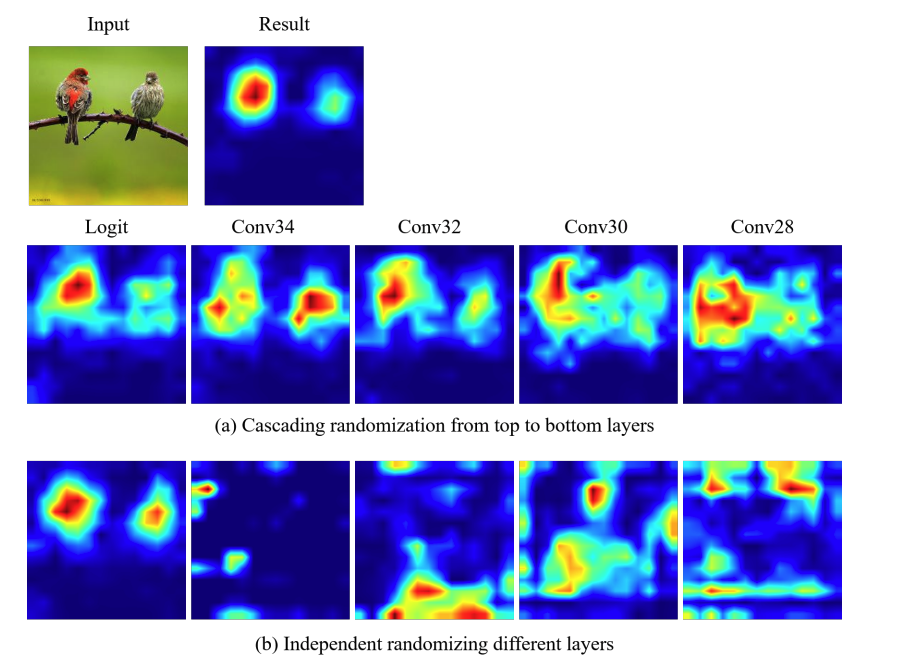
Sanity Check
Sanity Check is a method for evaluating XAI methods presented by the team at Google Brain. If the parameters are completely different, but the output is the same, it is not a good reflection of the learning results.
In this paper, we show that the method is parameter dependent by comparing the results obtained with heatmaps obtained by initializing the classifier to the target layer.
data augmentation
Group-CAM can also be applied to data augmentation methods. In the paper, we report that ResNet-50 improves accuracy by 0.59% on ImageNet-1k whenwkcis eliminated to shorten training time and error backpropagation is not used, and the mask is generated by Il ' where pixels below θ% are 0 and others are 1.
summary
CNNs can be roughly classified into activation-based and region-based models, and Group-CAM can be said to be a model that compensates for the shortcomings of both, with the advantages of reduced noise and low computational cost for inferring the basis of a single decision when using Grad-CAM. It will be interesting to see how this research will be applied to the visualization method of ViT in the future.


Categories related to this article