Stock Price Forecasting Using BERT And GAN
3 main points
✔️ Approach to stock price prediction using GAN
✔️ Using finBERT to input the results of financial market sentiment analysis
✔️ Succeeded in producing better results than previous models
Stock price prediction using BERT and GAN
written by Priyank Sonkiya, Vikas Bajpai, Anukriti Bansal
(Submitted on 18 Jun 2021)
Comments: Published on arxiv.
Subjects: Statistical Finance (q-fin.ST); Computation and Language (cs.CL); Machine Learning (cs.LG) Computing (cs.NE)
code:
The images used in this article are from the paper or created based on it.
Outline of Research
Technical analysis using technical indicators related to stock prices (e.g., moving averages) is generally widespread as a method for predicting movements in financial markets. Recently, stock price prediction using neural networks has become possible to some extent due to the development of computer performance and technology. In this paper, we propose a model with a GAN architecture that outperforms the performance of the previous models; GAN was originally proposed for image generation, but the proposed model generates one-dimensional arrays of data. In addition to various market data such as stock prices, technical indicators, etc., the results of sentiment analysis on financial markets using BERT were used for the training. it has been said in previous papers that GAN-based models perform well in predicting financial markets. The current model successfully outperforms the previous model.
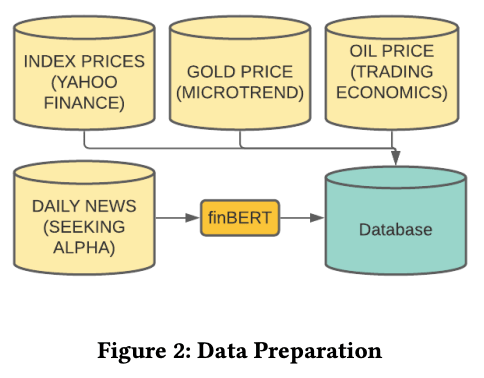
data set
The following is a rough breakdown of the datasets used.
- Apple.inc Stock Price Data
- Stock indices of the U.S. market such as S&P500, NASDAQ100, NYSE, etc.
- Stock indices of London, India, Tokyo, Hong Kong, Shanghai, and Chicago stock exchanges
- Commodity price data for so-called commodities such as gold, crude oil, and the US dollar
- Stock prices of companies known as Big Tech, such as Microsoft, Amazon, and Google
- Results of sentiment analysis of Seeking Alpha news and headlines using FinBERT
This forecast covers the stocks of Apple. inc. The stock price data was downloaded from Yahoo Finance. The period used is 10 years, from July 2010 to July 2020. For the stock price data, in addition to the low, high, opening, closing, volume, and adjusted closing prices*, technical indicators were also used.
To obtain a continuous view of the stock price before and after the implementation of the stock split, the closing price before the implementation of the stock split is adjusted to the post-split value and is referred to as the "adjusted closing price. Adjusted closing price - Yahoo! Finance
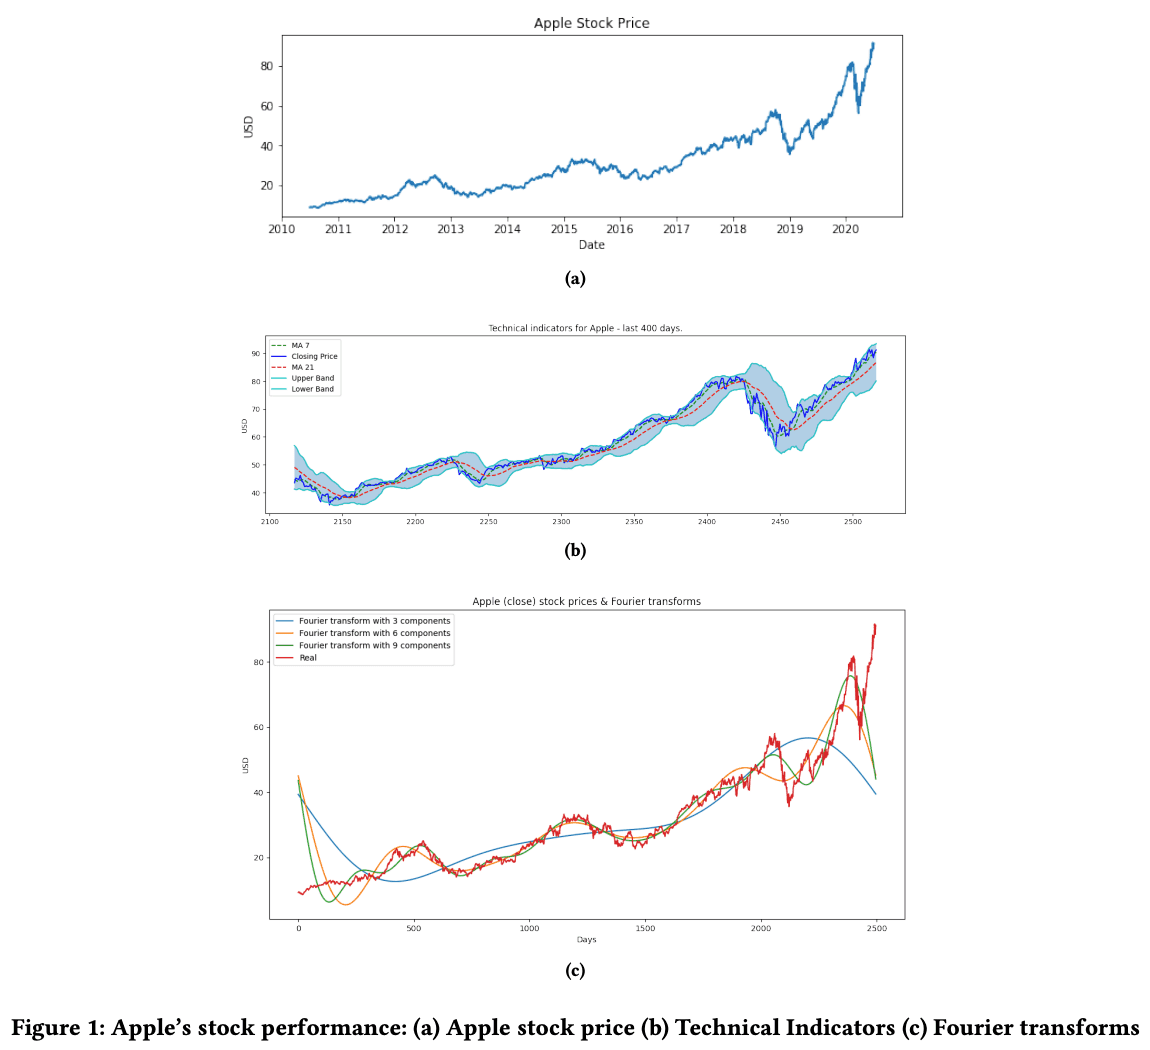
The technical indicators used were as follows
- Simple moving average of 7, 21 days
- A line connecting the average closing prices for the specified number of days
- Bollinger band
- The image of the deviation value at the time of the examination
- MACD (Moving Average Convergence Diffusion)
- The short-term moving average minus the medium-term moving average
- RSI (Relative Strength Index)
- An indicator to determine whether the market is overbought or oversold
- Fourier transform of the closing price
- Decompose the function into its trigonometric components. This time the calculation was done using closing values of 3, 6, and 9 respectively.
A detailed explanation of the theory behind each indicator is beyond the scope of this paper's commentary, but the following figure shows a plot of each indicator.
FinBERT
About Sentiment Analysis in Financial Markets. First of all, what is FinBERT, FinBERT is a fine-tuning of BERT with financial data for the financial sentiment analysis task. The training data used are the TRC2-Financial data and the Financial PhraseBank data.
For a more detailed explanation of FinBERT, you may want to read the following paper.
FinBERT: Financial Sentiment Analysis with Pre-trained Language Models
written by Dogu Araci
(Submitted on 27 Aug 2019)
Comments: Published on arxiv.
Subjects: Computation and Language (cs.CL); Machine Learning (cs.LG)
code:
For the sentiment analysis using FinBERT, news and headlines from the Seeking Alpha website from July 2010 to July 2020 were scraped and entered into FinBERT. Seeking Alpha is a web media company that has been in existence since 2004. A variety of investors and writers provide high-quality information.
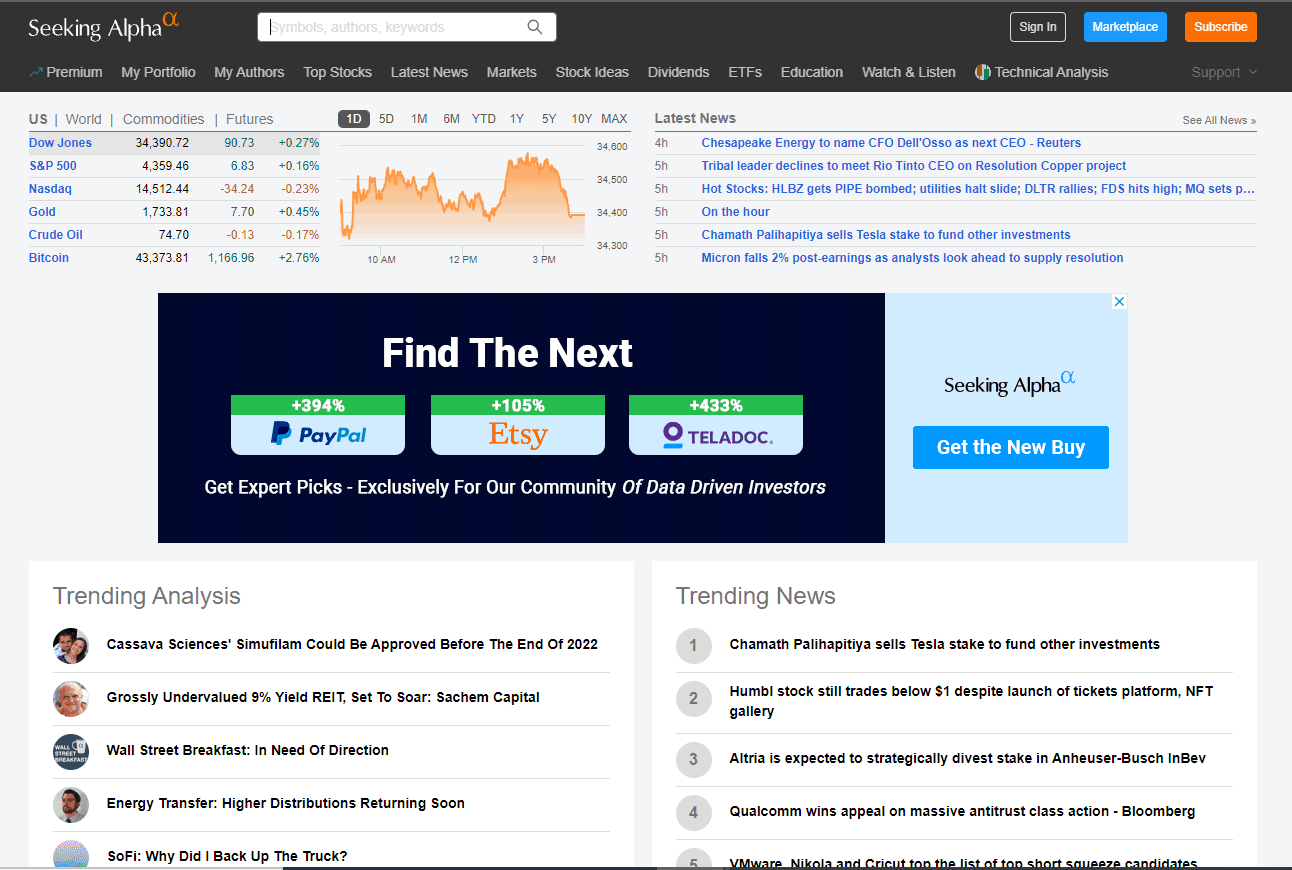
Image: https://seekingalpha.com/ (as of 12:50, 30/09/2021)
The sentiment analysis results output from FinBERT are then added to the dataset and are also passed to the GAN generator, described below.
To make this forecast, the look-back data step was performed for only three days. The data from the previous three days is used to predict the price for the next four days. The size of the data set is (2517, 37) where 2517 is the number of days and 37 is the number of columns. The period is 10 years, but the number of days is such because there is no trading in the market on holidays. We split the dataset 7:3 for training and testing, resulting in final data sizes of approximately 2010-2017 for training (1746, 3, 37) and 2017-2020 for testing (748, 3, 37), respectively. Here 3 represents the lookback time step parameter. Below is an overview diagram of the data set used in this study.
normalization (e.g. in floating-point representation system)
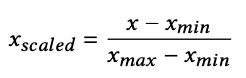
Finally, we normalize the data using the MinMax scaler from the scikit-learn library. Here xscaled refers to the normalized value, xmax refers to the maximum value and xmin refers to the minimum value. This reduces the complexity of the data by keeping the range of the data between -1~1.
proposed model
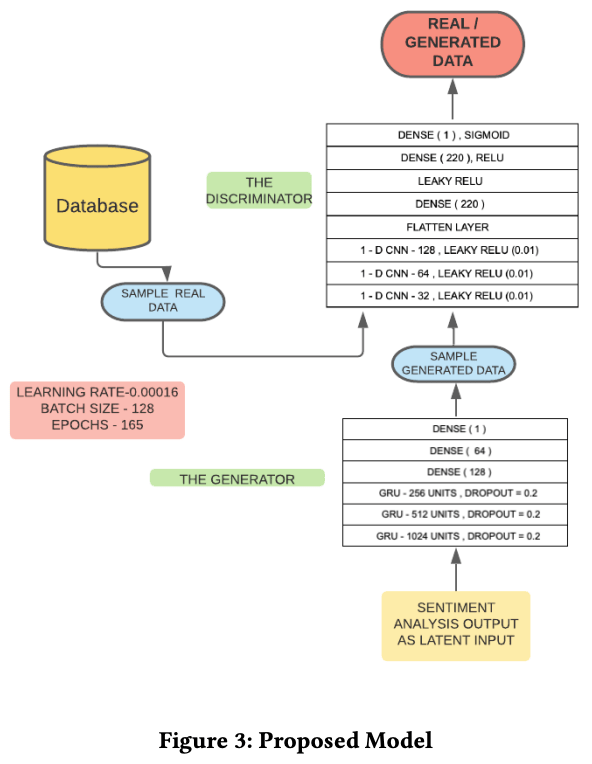
A GAN has two components: a generator and a discriminator. The generator generates data and the discriminator determines whether it is produced by the generator or not.GAN was initially proposed to generate images, but in the proposed model, it is constructed to generate an array of price data. In this section, we will discuss the details of the mathematical theory and construction of GAN. The overall picture of the proposed model is as follows.
Generator (GENERATOR)
The generator is represented by the following equation
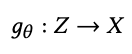
where θ represents the weights of the generator. In a normal GAN, Z refers to the N(0,1) input vector, but in the proposed model, it is replaced by the output of FinBERT's sentiment analysis. The generator seeks θ such that the generated data distribution is such that the output gθ (Z) of the generator is estimated by the discriminator to be the same as the distribution X of the actual price data.
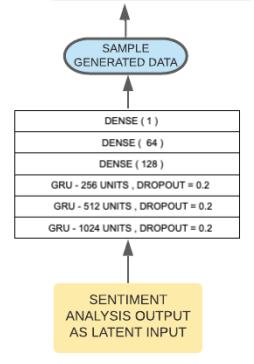
Generator Structure
In the proposed model, GRU (Gated Recurrent Units )* is used for the generator. The generator consists of 1024, 514, and 256 units in layers 1, 2, and 3 respectively. To prevent overtraining, a dropout rate of 20% is set for each layer. In addition, there is a fully coupled layer with 128, 64, and 1 unit. The output of the generator is the stock price of the next day of the input data, which is passed to the discriminator. The diagram of the generator is shown below.
GRU is a modification of the LSTM (long-short time memory) model, which is often used to analyze time-series data, etc. Since GRU can learn with fewer parameters than LSTM, it learns quickly and performs well even with a small amount of data.
DISCRIMINATOR)
The discriminator is represented by the following equation
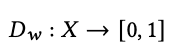
where w is the weight of the discriminator. The discriminator outputs 1 for the actual price data and 0 for the generated data.
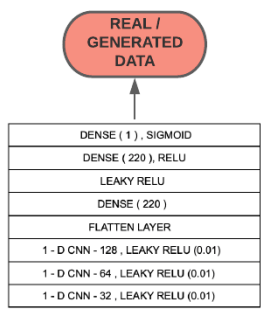
Structure of the discriminator
The discriminator is a 1D CNN (Convolutional NeuralNetwork) and the activation function is LeakyRelu (Leaky Rectified Linear Unit). LeakyRelu returns a value equal to the input value if the input value is less than zero. In this case, α is 0.01. In addition, for CNNs with three layers, the kernel size is (3, 5, 5). Following them, we have a flatten layer to convert the data convolved by the CNN to 1D, a full join layer with 220 units, a LeakyRelu layer with α set to 0.3, a full join layer with 220 units and Relu as the activation function, and a The following is a diagram of the discriminator. The following is a diagram of the discriminator.
loss function
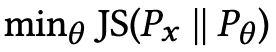
The loss function of GAN is based on the KL-JS divergence, and in the training step, cross-entropy is used to distinguish between two distributions (the actual data distribution Px and the generated data distribution Pθ ). By minimizing this cross-entropy, we can minimize the KL-JS divergence and obtain a distribution that is similar to the actual data.
GAN Model
The GAN model is expressed in terms of (θ, w) as follows
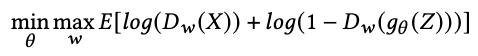
Since the generator wants the discriminator to judge the generated data as actual data (the part of Dw ( gθ (Z)), it tries to minimize the above equation. On the other hand, we want the discriminator to correctly classify the actual data and the generated data. Therefore, we maximize the above equation to classify them correctly. The result of differentiating the above equation and decomposing it into its respective weight components is shown below.
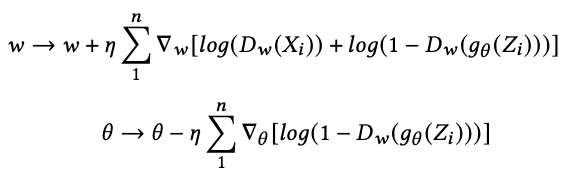
where 𝜂 denotes the learning rate. The discriminator learns by computing the loss between the distributions of the actual data and the generated data and then updating the weights to produce generated data that is closer to the actual data, which is then backpropagated to the generator.
experimental results
In addition to the proposed model, ARIMA, LSTM, GRU, and a plain vanilla GAN with noise as input (with the same parameters and configuration as the proposed model) were evaluated for prediction for comparison. The Root Mean Square Error (RMSE) metric was chosen to evaluate the models. Finally, the stock price prediction results after 5, 15, and 30 days were compared for each model. Here, the proposed model is named S-GAN. First of all, the graph shows the result of predicting the stock price of the next day.
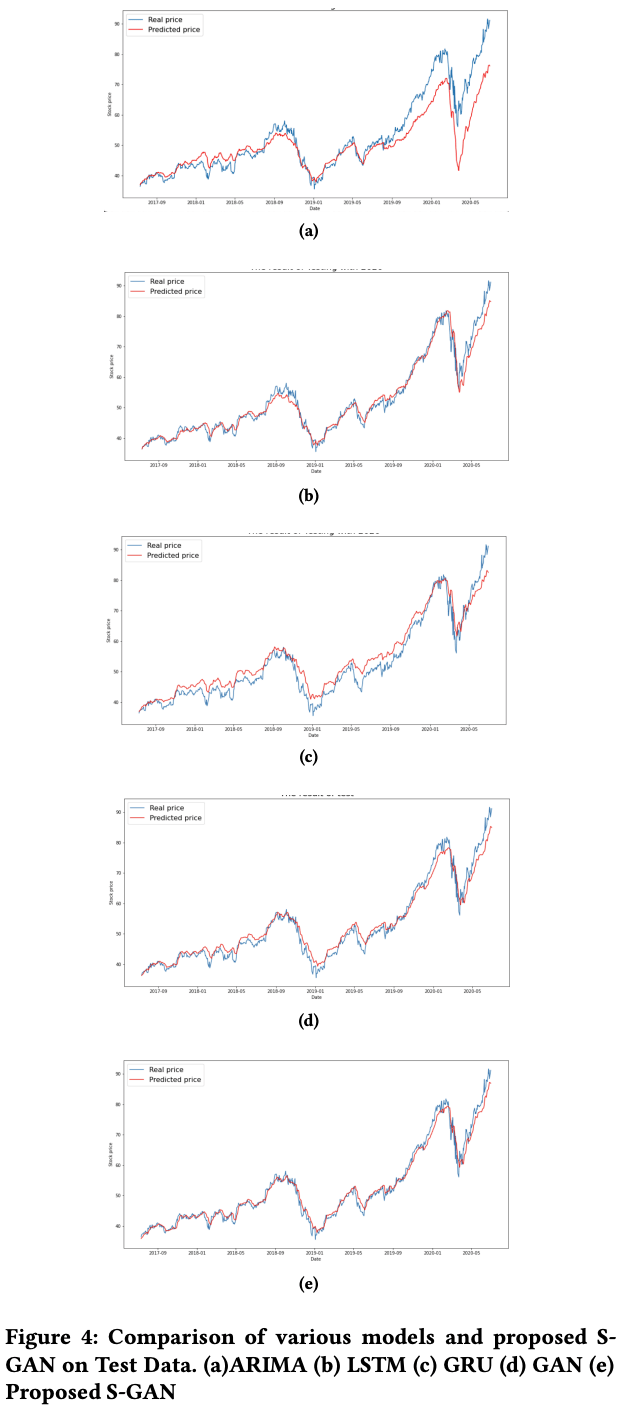
Although we can only take a subjective view by looking at the figure, we can see that the results look good around (b) LSTM, (d) GAN, and (e) S-GAN.
Next are the results of the RMSE values for each model.
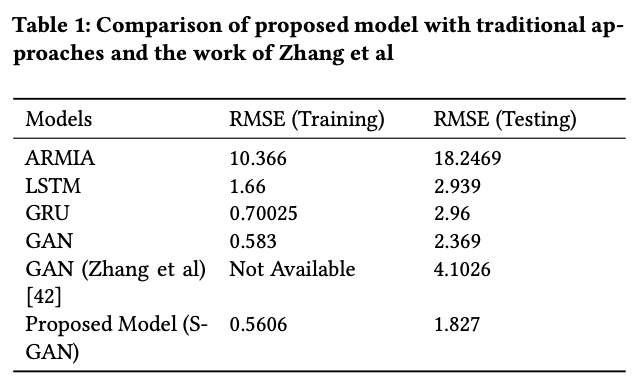
The GAN model proposed by Zhang et al. is described in the following paper.
Stock Market Prediction Based on Generative Adversarial Network
written by KangZhang, GuoqiangZhong, JunyuDong,ShengkeWang,YongWang.
Comments: Procedia Computer Science; Volume 147, 2019, Pages 400-406
In our experiments, we trained with the same hyperparameters that were shown in the overall diagram of the model above. The learning rate was 0.00016, the batch size was 128, the number of epochs was 165, and the weights were updated using optimization by Adam. Using the training data from the proposed model (in this case S-GAN) from 2010 to 2017, the training RMSE was 0.5606; the test RMSE computed on the data from 2017 to the end was 1.827. It can be seen that the proposed model performed the best in both training and test scores.
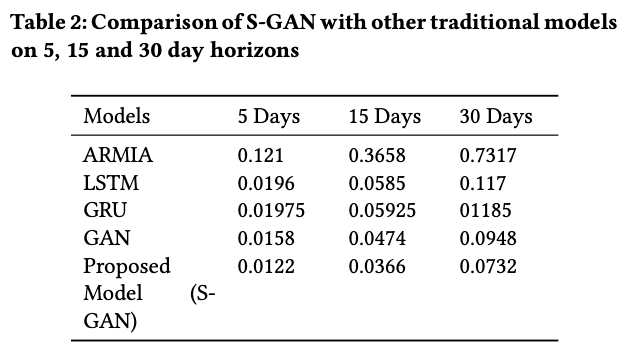
Finally, here are the prediction results for 5, 15, and 30 days. The graphs above show the predicted and actual prices for each model for 5, 15, and 30 days, in order from left to right. The table below shows the RMSE scores of the models.
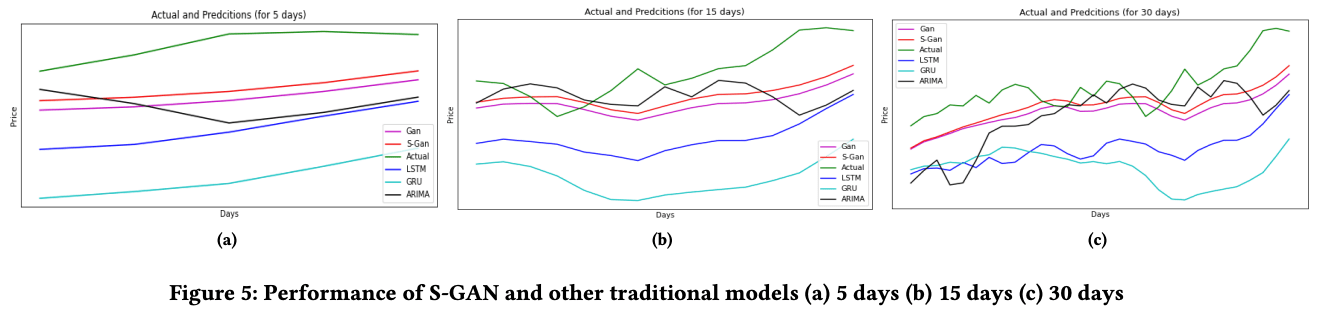
This shows that the predictions have almost the same slope as the GAN models. The only difference between the GANs and the plain GANs that I can say for sure is in the input to the model, as I read the paper, and the input to the proposed model is the results of FinBERT's sentiment analysis, which shows the impact, or the effectiveness of using sentiment analysis in financial markets.
summary
In this paper, we find that a GAN with GRU as generator and CNN as discriminator outputs better results than other models in the stock price prediction task by using the results of financial market sentiment analysis using FinBERT. In other words, player sentiment in financial markets influences the market. The challenge is that the model predicts the next day's stock price after the close of trading for the day, so it should be able to make predictions in real-time during trading hours. However, being able to predict the next day's price to some extent at the end of one day's trading could be enough information for players.
Impressions
From my point of view, I feel the significance of predicting the stock price a few days or weeks ahead rather than a day or a few hours ahead, but I also feel the difficulty of doing so. It is rare for stock prices to rise so rapidly that profits can be made in a short period, and on the other hand, predicting stock prices several months in the future is more complicated and requires consideration of various factors. That's not to say that it's impossible to predict the financial markets. My personal opinion is that it is nonsense to challenge the random walk nature of the market with pattern recognition, but I believe that the accuracy will continue to improve with each new model and effort, such as the application of GAN to time series tasks. Considering how far we can go in the future, I think this is one of the fields worth continuing to research.


Categories related to this article


