
Visualizing The Degree Of Brain Aging! Self-supervised Learning Method Using Two MRI Images
3 main points
✔️ Proposed a machine learning model that can be used for analysis of long-term MRI
✔️2 By using two MRI image pairs as input, it is possible to train on many training samples
✔️ By introducing LNE, we successfully obtained a feature vector representing the degree of brain aging and obtained ideal visualization results
Self-Supervised Longitudinal Neighbourhood Embedding
written by Jiahong Ouyang, Qingyu Zhao, Ehsan Adeli, Edith V Sullivan, Adolf Pfefferbaum, Greg Zaharchuk, Kilian M Pohl
Submitted on 5 Mar 2021 (v1), last revised 17 Jun 2021 (this version, v3)
Comments: Provisional Accepted by Medical Image Computing and Computer Assisted Intervention (MICCAI) 2021
Subjects: Computer Vision and Pattern Recognition (cs.CV)
code:
The images used in this article are from the paper, the introductory slides, or were created based on them.
Introduction
Long-term MRI is often used to capture the decline in brain structure and function caused by neurological disease and aging.
This paper aims to use machine learning to analyze long-term MRI images, but there are challenges in data collection. Two of these challenges are the difficulty of collecting large amounts of data and the disparate intervals between each subject's MRI scans.
Therefore, this paper proposes a self-supervised learning method that can obtain better feature representations from a small number of unaligned MRI image data.
The effectiveness of the proposed method was confirmed by comparing it with other methods in two downstream tasks that estimate age and the degree of progression of Alzheimer's disease from MRI images. This suggests that the proposed method can perform better feature extraction. We have also visualized the features and confirmed that features (vectors) representing brain deterioration have been acquired.
Proposed Method
The overall model of the proposed method is shown below.
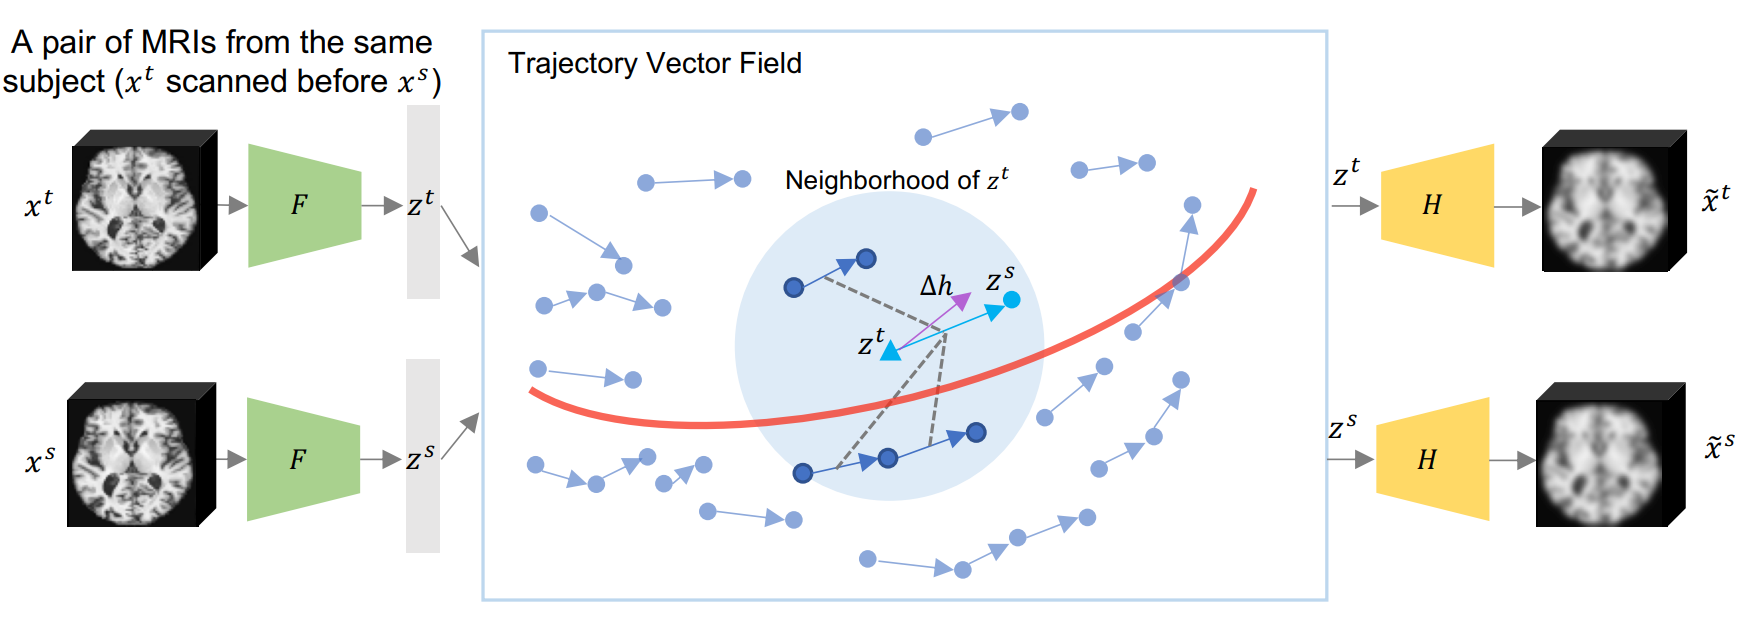
This model has two main features.
The first is that the model is an Encoder-Decoder structure with two MRI images as input and output.
The second is to learn the trajectory vectors obtained from the feature vectors extracted from the two MRI images.
These features are described one by one below.
(1) Pairwise Training Strategy
The proposed model uses two MRI images for training. By inputting two pairs of MRI images for each subject, rather than all at once, the number of training samples can be significantly increased.
The two MRI images ( xt, xs ) [1] are transformed by Encoder(F) into the latent representations ( zt, zs ) [2], respectively. The difference of the latent representation vectors obtained here (Δz(t,s) = ( zs-zt ) / Δt(t,s)) [3] represents the brain change per unit time.
The latent representations ( zt, zs ) are used to reconstruct ( x~s, x~t ) the input image by Decoder(H), respectively, and the reconstructed image is trained to approach the input image.
Longitudinal Neighbourhood Embedding (LNE)
This section describes the learning of the trajectory vector, which is the difference between latent representation vectors, which is the second feature of the model of the proposed method. Based on the hypothesis that similar MRI images will result in similar changes in their trajectory vectors, we learn to follow this assumption. In other words, the trajectory vectors are trained to smooth the trajectory vector space. This is inspired by social pooling [4], a smoothing method used in pedestrian trajectory prediction tasks.
However, while social pooling targets a two-dimensional space, this paper targets a latent space and cannot be applied as is. Therefore, we propose to define a neighborhood using an effective graph.
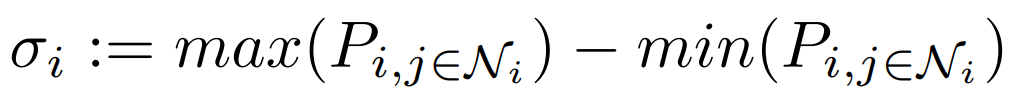
An effective graph is constructed in mini-batches [5] for each learning step (epoch). The position of each node in the effective graph is zt and the value of the node is Δz. Therefore, the distance between nodes (at nodes i and j) can be expressed as Pij = |zti-ztj|2 using Euclidean distance. Let the nearest node to node i to the Nnbth node be its neighbor ( Ni ), and define the adjacency matrix A as follows
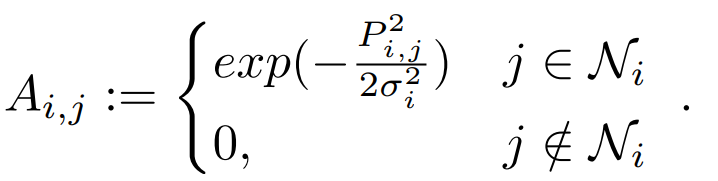
The adjacency matrix A represents the relationship between nodes.
Nodes ( j∉Ni ) that are not neighbors of node i are not considered and therefore take 0 (in the adjacency matrix A). On the other hand, nodes that are neighbors of node i (j ∈ Ni ) are filled with the normalized distance converted to similarity.
This adjacency matrix A is used to obtain a pooled vector of neighborhood vectors, Δh ( LNE; Longitudinal Neighborhood Embedding ). Specifically, the following equation, which is derived from the graph diffusion process, can be used to calculate Δh. 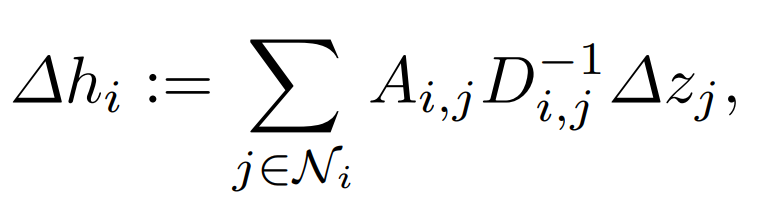
D is the out degree matrix of the graph G, a diagonal matrix that represents the sum of the outward edge weights of each node.
Although we have followed complicated mathematical formulas up to this point, a simple explanation is that for each trajectory vector ( zti ), a set of neighborhood vectors ( Ni ) is defined, and the direction Δh in which Δz is expected to face when these vectors are considered is determined (by pooling).
The resulting Δh is used to modify Δz, which promotes smoothing of the trajectory vector space.
Objective Function
Finally, we introduce the loss function of the model of the proposed method and summarize the learning method.
The loss function is shown below.

The first and second terms represent the reconstruction loss (①) of the input image obtained through the encoder and decoder.
The third term is used to bring the orientation of the trajectory vector Δz closer to Δh obtained by pooling the trajectory vectors in the neighborhood (②), and can be regarded as a kind of regularization.
Experiment
In this paper, the effectiveness of the proposed method is tested on two downstream tasks: the first is a task to estimate age from MRI images of healthy subjects ( Health Aging ), and the second is a task to estimate the degree of progression of Alzheimer 's disease (ADBI). There are four classes of ADBI: NC (Normal Control), AD (Alzhaimer's Diease), sMCI (static Mild Cognitive Impairment), and pMCI (progressive Mild Cognitive Impairment). This paper examines them as a binary classification task, i.e., NC or AD, sMCI or pMCI.
Accuracy Comparison in Downstream Tasks
Accuracy comparisons are made using the coefficient of determination (R2) for the age estimation task (Health Aging) and (BACC; Balanced Accuracy) for the task to estimate the degree of progression of Alzheimer's disease.
Comparative results between the proposed method and other methods are shown below. 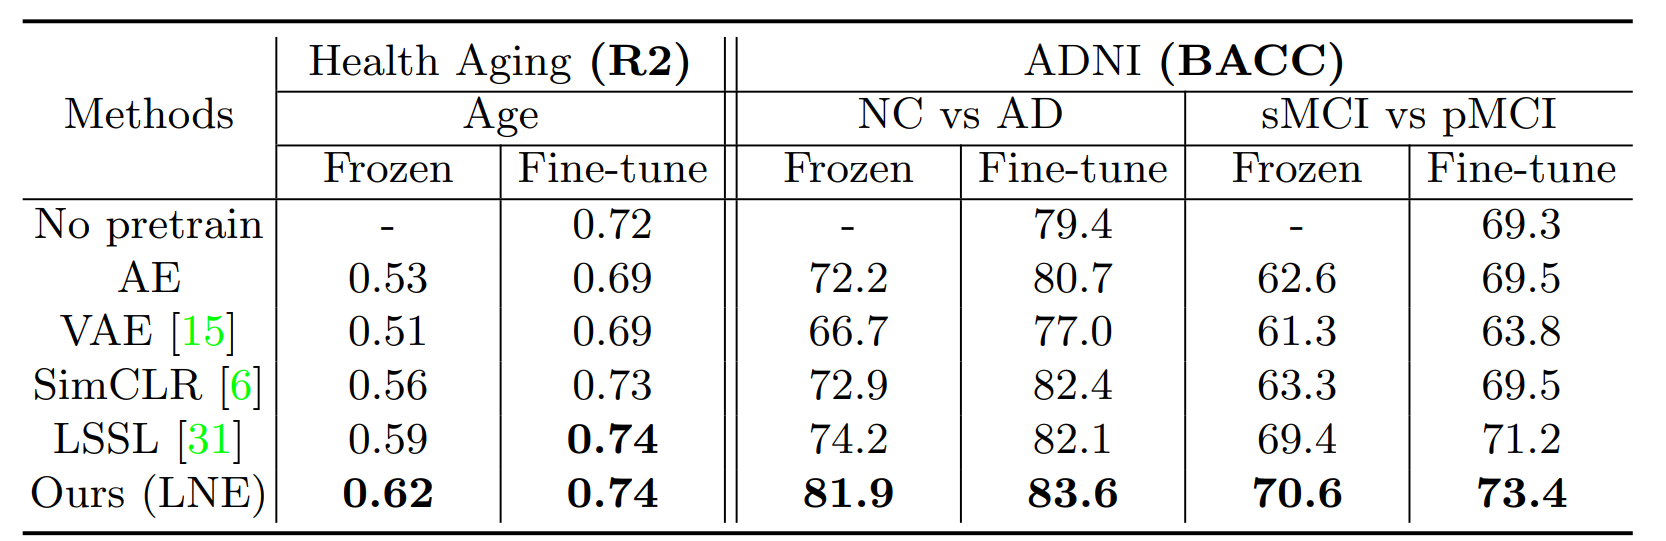
Frozen represents the case where the feature extraction part (Encoder part of the proposed method) is not trained again when training the downstream task, and Fine-tuning represents the case where it is trained again.
It can be seen that the proposed method achieves the highest accuracy on both datasets. This result indicates that the proposed model is able to extract better features from MRI images.
Visualization (data, results, etc.)
The following figure visualizes the trajectory vectors obtained by AE (Auto Encoder) and the proposed method in the Health Aging task. However, the obtained trajectory vectors are compressed by PCA due to their high dimensionality.
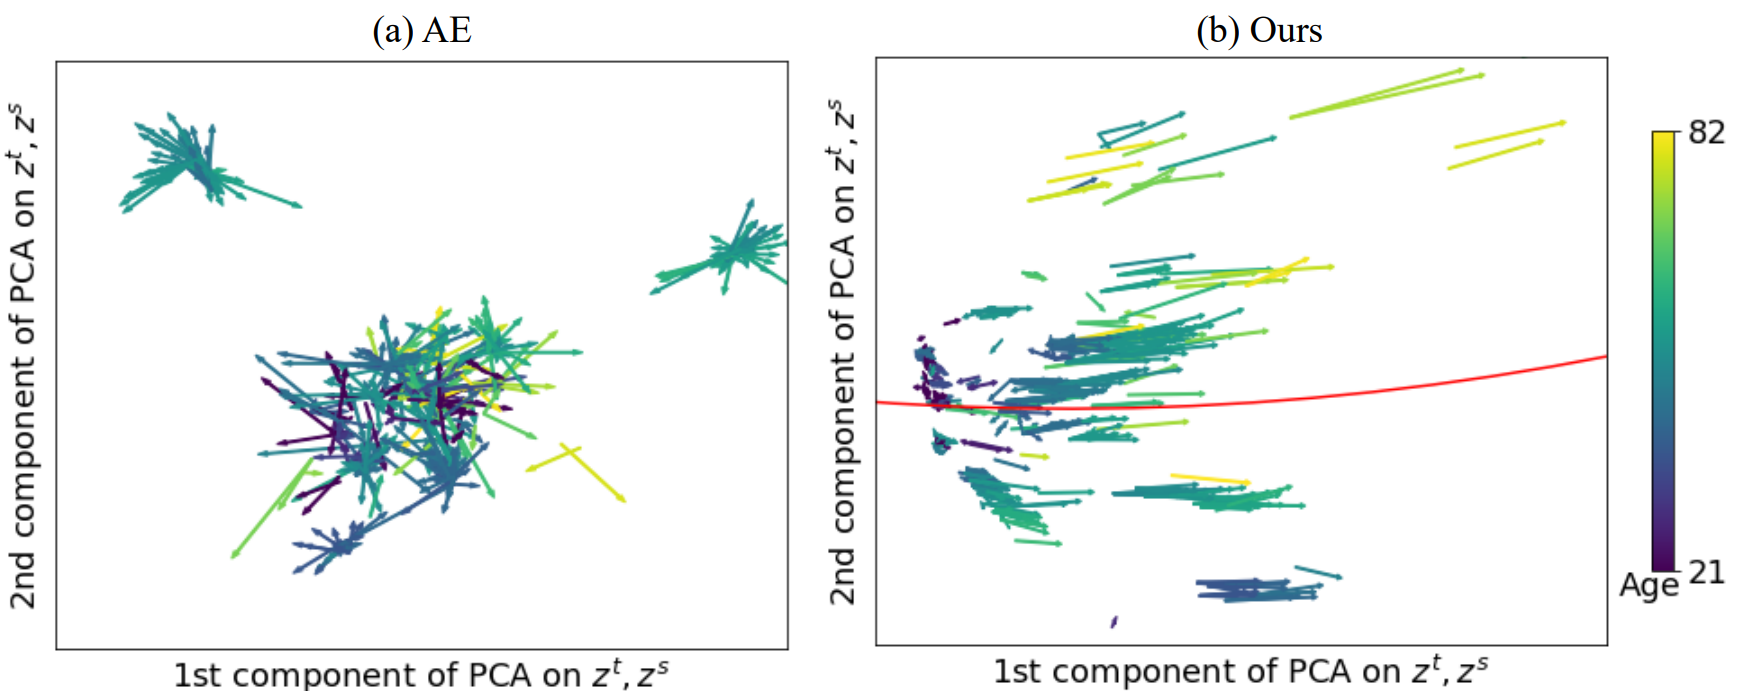
The result shows that in AE (left), the trajectory vectors are oriented in various directions, whereas in the proposed method (right), the trajectory vectors are mostly oriented in the same direction. This result indicates that LNE is able to form a smoothed trajectory vector space.
We can also confirm that the older the age (lighter colored vectors), the longer the trajectory vectors tend to be. This suggests that the older one gets, the faster the aging process becomes.
Next we will look at visualization in ADBI tasks.
(a) and (b) are visualizations of the trajectory vectors of the proposed method as well as the Health Aging task, color-coded by age in (a) and by class representing the degree of progression of Alzheimer's disease in (b). In (c), the length of the trajectory vector is calculated for each class representing the degree of progression of Alzheimer's disease.
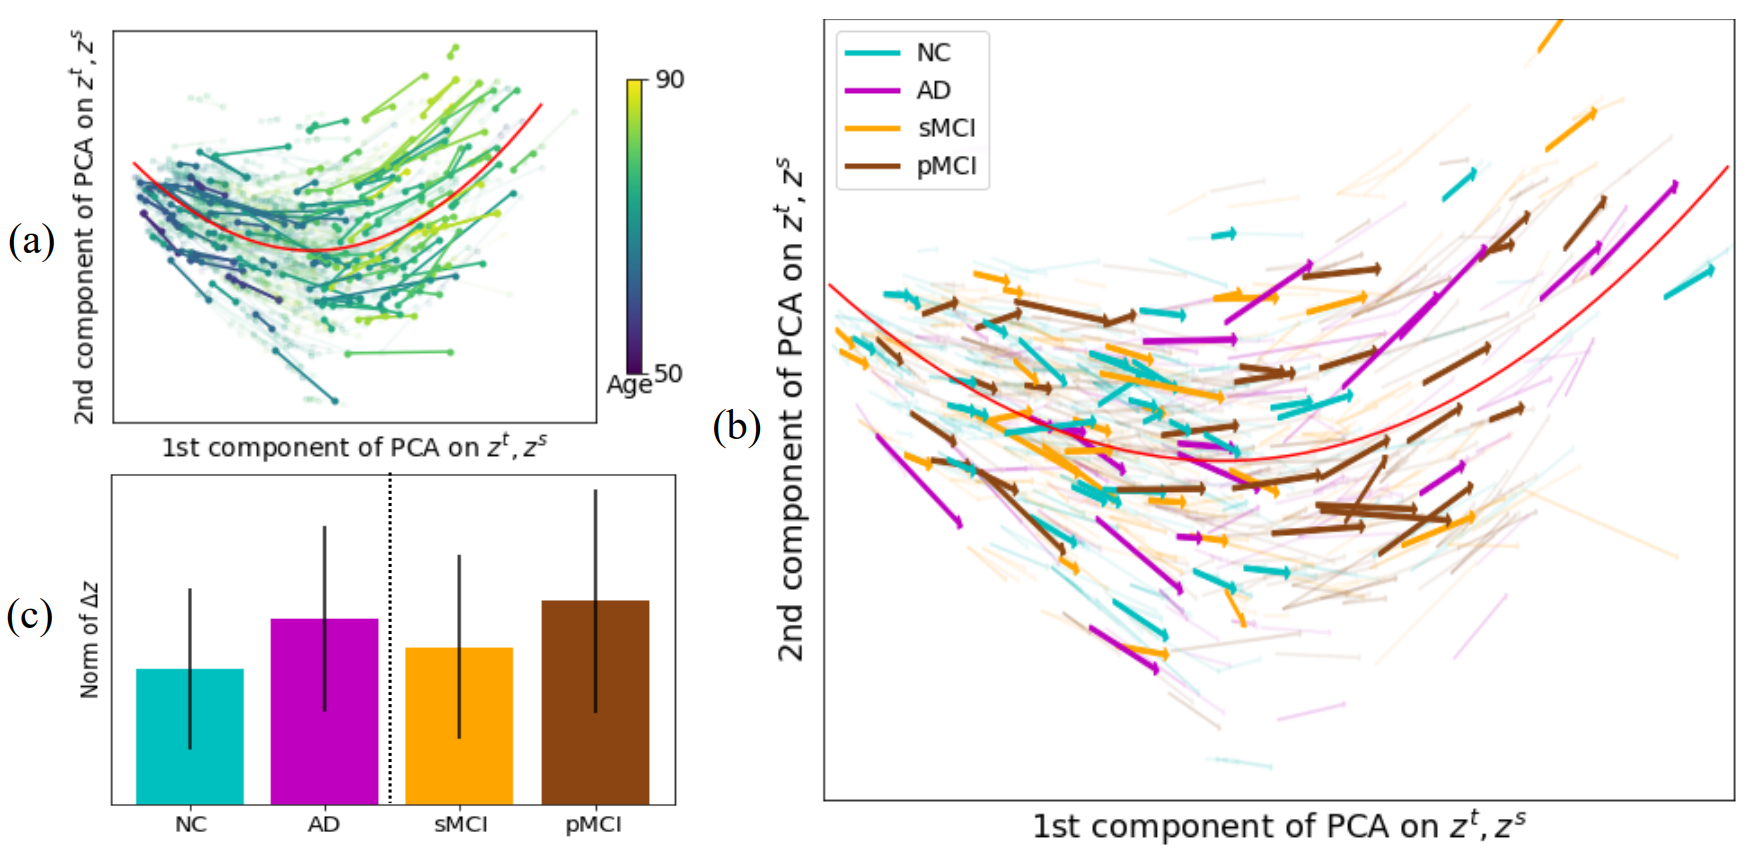
Looking at (a) and (b), we can see that the direction of the trajectory vectors are mostly aligned, as in the Health Aging task.
The tendency for the trajectory vectors to become longer as age increases (lighter colored vectors) from (a) can be confirmed in the same way.
Looking at (c), we see that the AD trajectory vector is longer than that of NC. This suggests that people with advanced Alzheimer's disease have a faster progression of brain aging. And this result follows previous studies in Alzheimer's disease; similar trends can be seen in sMCI and pMCI.
Summary
In this article, we introduced a self-supervised method using two MRI images.
Since lack of data is a common issue (especially in the medical domain), I thought this approach would be helpful in many situations.
I also thought that the analysis through visualization of trajectory vectors was convincing and one of the good examples that contribute to improving the reliability of AI in the medical field.
Supplement
[1] xt is always constrained to be before xs in time
[2]Both zt and zs are 512 dimensional
[3]where Δt(t, s) is the difference in time between the two MRI images scanned
[4]The details of social pooling are described in the following paper
・ Social LSTM: Human Trajectory Prediction in Crowded Spaces
・ Social GAN: Socially Acceptable Trajectories with
Generative Adversarial Networks
[5]The batch size in this paper is 64


Categories related to this article

![DrHouse] Diagnostic](https://aisholar.s3.ap-northeast-1.amazonaws.com/media/February2025/drhouse-520x300.png)
![SA-FedLoRA] Communic](https://aisholar.s3.ap-northeast-1.amazonaws.com/media/October2024/sa-fedlora-520x300.png)
![[SpliceBERT] A BERT](https://aisholar.s3.ap-northeast-1.amazonaws.com/media/July2024/splicebert-520x300.png)
![[IGModel] Methodolog](https://aisholar.s3.ap-northeast-1.amazonaws.com/media/July2024/igmodel-520x300.png)