Evaluate The Performance Of Your Model's Architecture Without Learning! Introduction To NASWOT
3 main points
✔️ Neural network structure search (NAS) is computationally time-consuming and needs to be accelerated
✔️ Proposed a scoring method where the network performance is the activation of ReLUs in the network for a mini-batch
✔️ Evaluate neural networks without learning
Neural Architecture Search without Training
written by Joseph Mellor, Jack Turner, Amos Storkey, Elliot J. Crowley
(Submitted on 8 Jun 2020 (v1), last revised 11 Jun 2021 (this version, v3))
Comments: ICML 2021
Subjects: Machine Learning (cs.LG); Computer Vision and Pattern Recognition (cs.CV); Machine Learning (stat.ML)
code:

The images used in this article are from the paper, the introductory slides, or were created based on them.
Research Outline
In this study, we have improved the speed-up of neural network structural search (NAS), which is a bottleneck in the performance evaluation of a model in the process of search. In this work, we focus on the ReLUs in the network and score the model based on how active the ReLUs are for a mini-batch of datasets without training. This kind of scoring allows us to evaluate the network without letting it learn and allows us to perform very fast exploration.
research background
What is NAS?
NAS (Neural Architecture Search) is a method to automatically search the structure of neural networks. One of the most famous ones is Zoph&Le (2017)(https://arxiv.org/abs/1611.01578). In this method, a candidate network is generated by a generator using RNNs and is trained to evaluate its architecture. Based on the evaluation value, the next candidate network is explored by reinforcement learning. This method is an epoch-making method that can automatically search neural network architectures, but it is very computationally expensive because the evaluation of candidate architectures is done by actually learning them, and it is a method that requires considerable computing resources.
Learning-free, architectural scoring
Since the scoring of candidate architectures is the bottleneck of the search in NAS, there is a need to speed up that part of the search. Therefore, we proposed a method for scoring candidate architectures without actually training them.
The authors made one hypothesis about the performance of the architectures on the dataset. That is, the better an architecture reflects differences in input data, the better the architecture should perform. This comes from the idea that if the input data is different but the model produces similar outputs, it will be harder to learn the differences between the different input data, and therefore less likely to produce good results. To reflect this hypothesis in their method, the authors focused on the presence or absence of ReLU activation in the model.
When data is entered into the model, each ReLU in the model is represented by a binary value, 1 if it is active and 0 otherwise, indicating whether it is active or not. By examining and ordering these values for each ReLU, we obtain a vector of the length of the number of ReLUs in the model when a single piece of data is entered into the model. The vector thus obtained is considered to be the behavior of the model for that data. We compare this vector for each data to see if it reflects differences concerning the input data.
Now we would like to explain how exactly we do this. For data i, we consider a vector ci that lists the activation/deactivation of the ReLU of the model. The activation of ReLU is considered as a binary value, i.e., if the output of ReLU is less than or equal to 0, it is inactive, otherwise, it is active. At this time, this vector ci is a binary code sequence. This vector ci will represent the degree of activation of this model for data i. We randomly take a mini-batch of N data from the dataset and compute this vector c for all the data in the mini-batch. This yields a sequence of binary codes from vector c1 to cN. The authors hypothesize that the score is the degree to which the model behaves differently depending on the input data, so the difference between these binary code sequences needs to be quantified. To quantify the difference between vectors, the authors used the Hamming distance. For each combination of data, the Hamming distance is calculated and the matrix KH is considered.
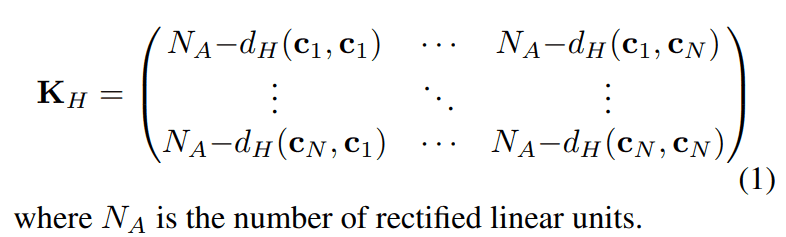
Since this KH is a matrix, it is inconvenient to treat it as a score. To convert it to a scalar value, we find the determinant of KH and convert it to a logarithmic scale.
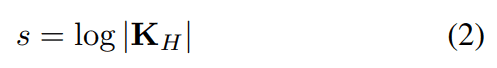
This s is the score for this model. We will now verify that this scoring method works correctly.
Validation of scoring methods
Relevance of KH
For the two datasets (NAS-Bench-201, NDS-DARTS), we compute the KH for multiple architectures; after normalizing each element of the KH, the result is illustrated in the figure below.
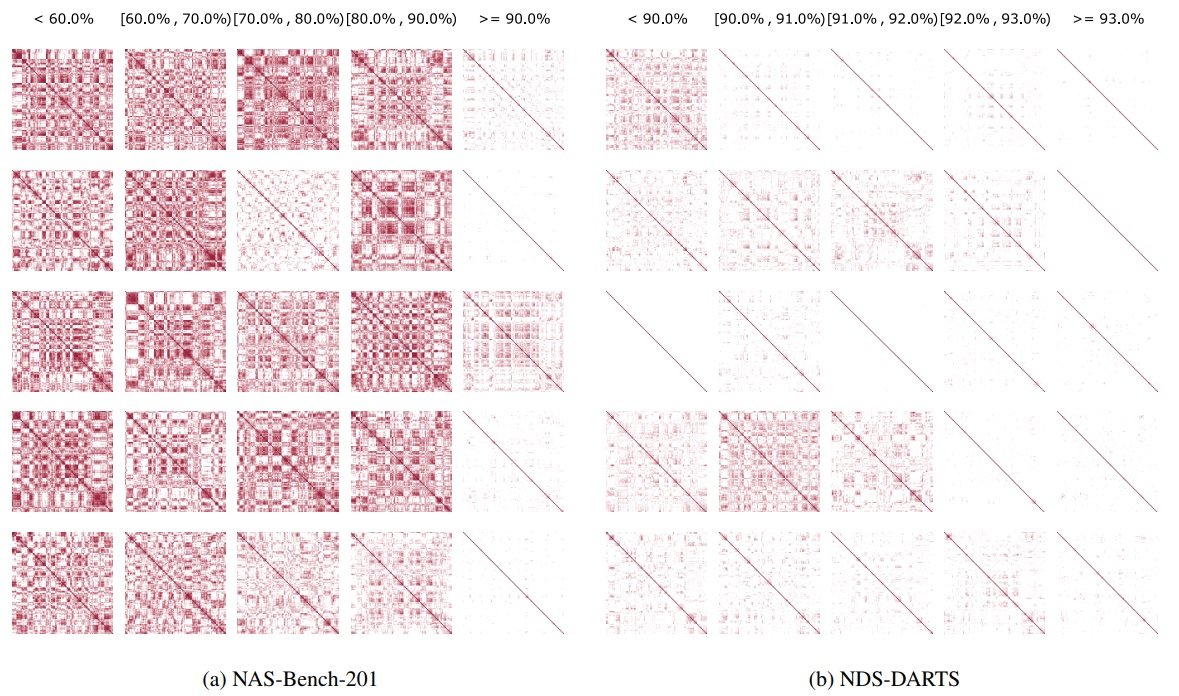
The top row represents the final accuracy when the model is trained. This figure shows that KH has a large correlation between architectures that achieve high final accuracy and those that do not. Those that achieve low accuracy have more dark colors (values close to 0), while those that achieve high accuracy have more white colors (values close to 1). This shows that the degree of activation for the input data in the model before training is highly related to the final accuracy.
Scoring validity
For each dataset, the figure below shows the relationship between the score from the scoring of the proposed method and the final validation accuracy of the architecture.
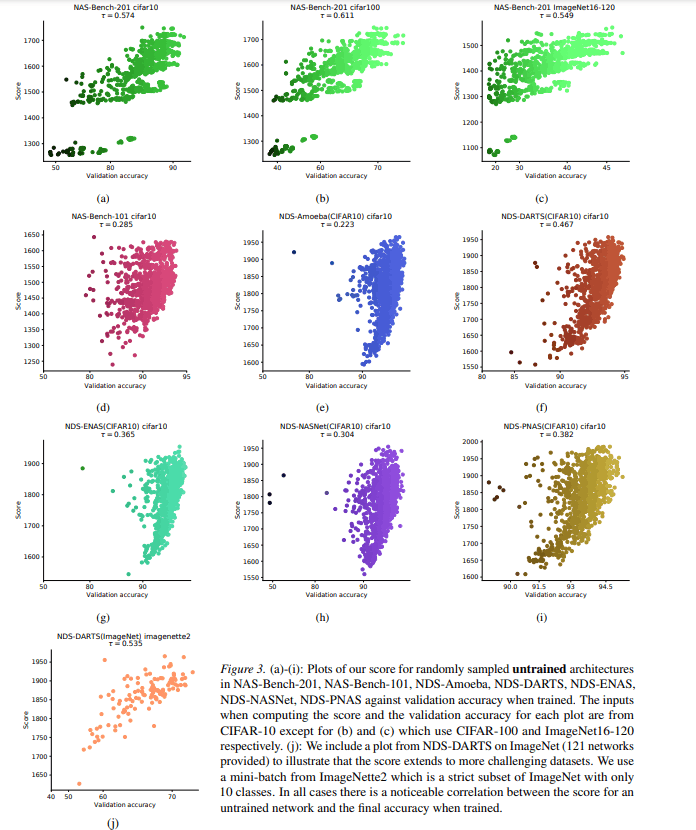
In this figure, the horizontal axis represents the validation accuracy of the model and the vertical axis represents the score of the model. The figure shows that the architectures with higher scores are more likely to achieve higher validation accuracy for any dataset. This confirms that the scoring of the proposed method is valid. The figure below also verifies the extent to which the scores vary depending on the difference in the data chosen for the mini-batch, the initial values of the parameters of the model, and the size of the mini-batch.
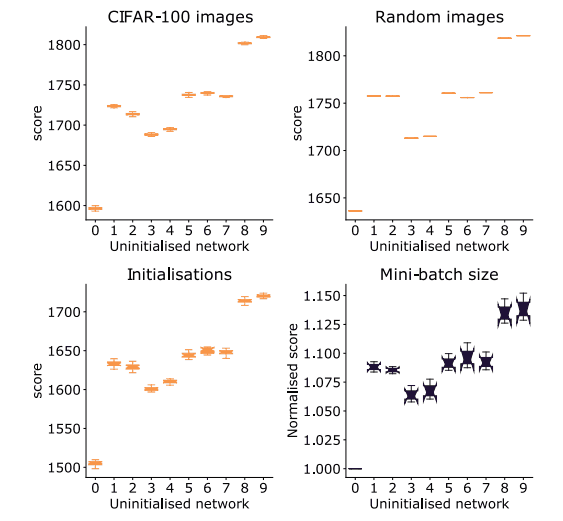
This figure takes the network identifiers on the horizontal axis (10 different networks are compared in this figure) and the scores of those networks on the vertical axis. This figure shows that there is some variation in each of them, but there is no difference in their relative scores, and the scoring is robust in any case.
The figure below also compares the scores when the model's parameters are initially set to their initial values and when the model continues to be trained, to see if the order of the scores can fluctuate.
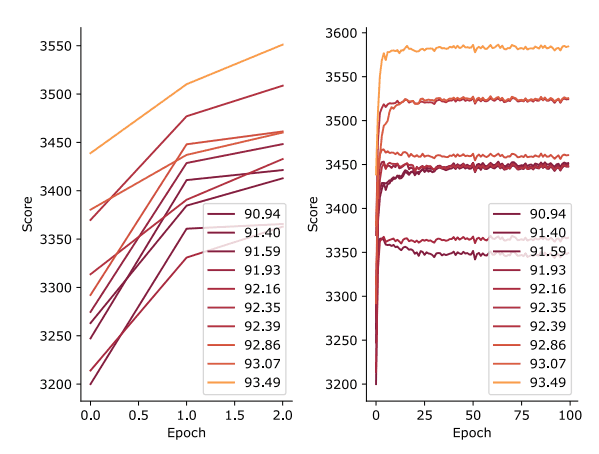
This figure shows the number of epochs on the horizontal axis and the score at that point on the vertical axis. The figure shows that the scores themselves all improve as the learning progresses, but there is little variation in the relative rankings, indicating that the scores of the pre-training state can be used to determine the architecture's score.
Neural Architecture Search without Training - NASWOT
From here, we will use the aforementioned scoring to explore architectures and verify how much performance architectures can be explored and how much time and computation cost are required for such exploration.
For the search, we use the method of Zoph&Le (2017), which is a well-known NAS method. In this method, candidate architectures are trained and scored by their validation accuracy, but only the child scoring part is replaced by the proposed method. The method with this replacement is called NASWOT.
The figure below compares the existing method and NASWOT for each dataset.
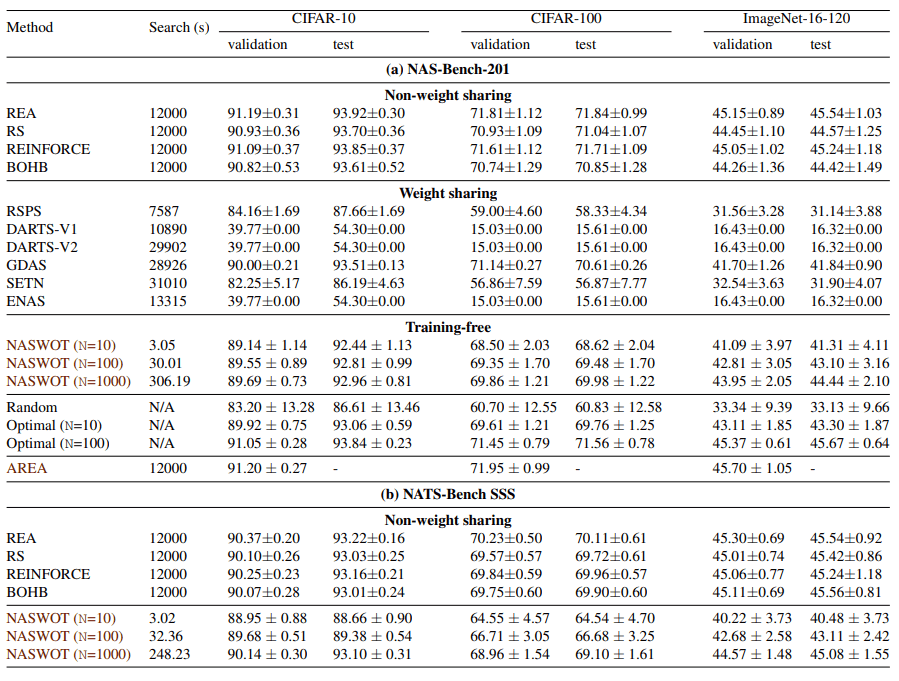
This figure shows that NASWOT is very fast in the search time. Also, the test accuracy of the explored architectures is no worse than the other methods.
Next, we examine the relationship between search time and test accuracy. The following figure illustrates the relationship between search time and test accuracy.
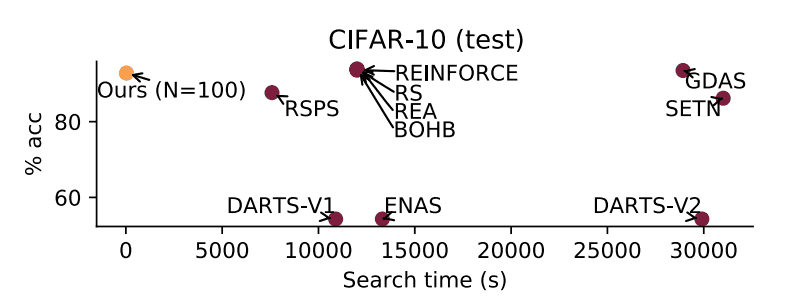
This figure plots the search time on the horizontal axis and the final test accuracy achieved on the vertical axis. The figure shows that the final test accuracy achieved is comparable and the search is very fast.
summary
NAS has been plagued by an intractable search space and very high search costs. In this work, we propose a method that can easily score the architecture of a neural network in its initialized state, and incorporate this method into the traditional NAS method to dramatically reduce the search time.


Categories related to this article