Is The Evaluation Of Deep Reinforcement Learning Algorithms Accurate?
3 main points
✔️ Examine the bias and uncertainty of deep reinforcement learning evaluation criteria
✔️ Revisit the existing algorithm evaluation
✔️ Propose more effective evaluation criteria under a low number of runs
Deep Reinforcement Learning at the Edge of the Statistical Precipice
written by Rishabh Agarwal, Max Schwarzer, Pablo Samuel Castro, Aaron Courville, Marc G. Bellemare
(Submitted on 30 Aug 2021 (v1), last revised 13 Oct 2021 (this version, v3))
Comments: NeurIPS 2021.
Subjects: Machine Learning (cs.LG); Artificial Intelligence (cs.AI); Methodology (stat.ME); Machine Learning (stat.ML)
code:

The images used in this article are from the paper, the introductory slides, or were created based on them.
first of all
Existing evaluations of deep reinforcement learning (RL) algorithms rely on comparing point estimates such as mean and median task performance and tend to ignore statistical uncertainty.
This trend is becoming more acute as benchmarks become more computationally demanding, making it more difficult to increase the number of runs for performance evaluation.
In the paper presented in this article, we showed the problem of the existing evaluation methods that rely on point estimates and proposed a more rigorous evaluation method. Let's take a look at it below.
On performance measures of reinforcement learning algorithms
Suppose that for a reinforcement learning algorithm, $m$ tasks are performed $N$ times and used to evaluate its performance.
where each normalized score is denoted by $x_{m,n}$($m=1,... ,M, n=1,... ,N$), and we denote these sets as $x_{1:M,1:N}$ and the probability variable of the normalized score of the $m$th task as $X_m$.
A commonly used performance measure for reinforcement learning algorithms is the sample mean or sample median of the normalized score.
This is represented by $Mean(\bar{x}_m=\frac{1}{N}\sum^N_{n=1}x_{m,n}$ or $Median(\bar{x}_{1:M})$ if the average score for task $m$ is $\bar{x}_m=\frac{1}{N}\sum^N_{n=1}x_{m,n}$.
These values are the point estimates of $Mean(\bar{X}_{1:M})$ and $Median(\bar{X}_{1:M})$.
On point estimation in the Atari 100k benchmark
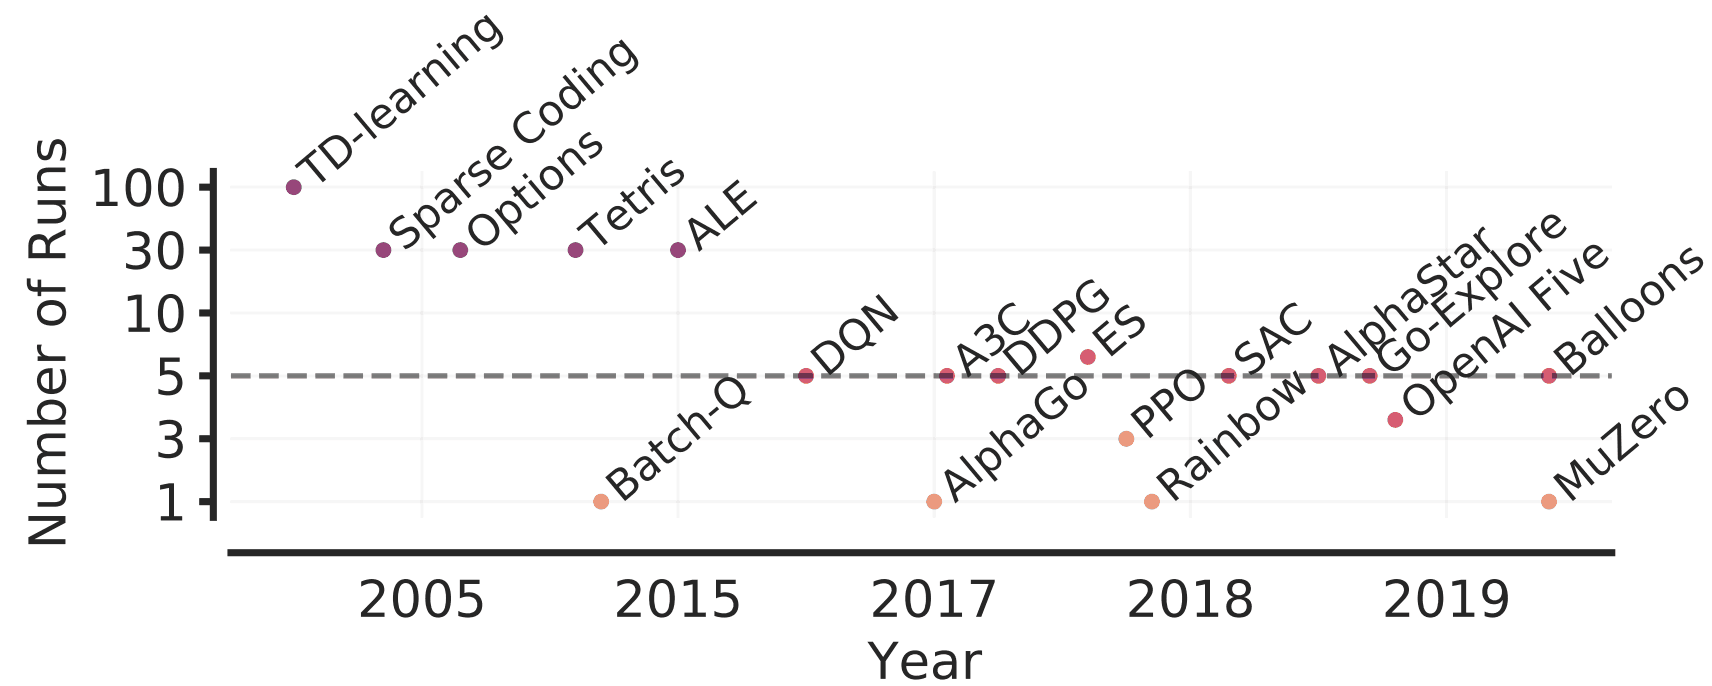
The Atari 100k benchmark evaluates the algorithm on 26 different games, each with only 100k steps. In previous cases using this benchmark, the performance was evaluated by 3, 5, 10, and 20 runs, most of which were only 3 or 5 runs. Also, the sample median is mainly used as the evaluation metric.
In this section, we compare the performance of five recent deep RL algorithms as a concrete example of using point estimates for evaluation under a small number of runs.
In our experiments, we run each of the five algorithms, DER, OTR, DRQ, CURL, and SPR, 100 times, subsample a portion of the runs, and measure the median.
We will use this to investigate the median for a small number of runs.
The magnitude of Variation in Point Estimates
During subsampling, we collect the same number of results as the number of runs in the paper; we find the median for 5 runs for DER, OTR, and DRQ, 20 runs for CURL, and 10 runs for SPR.
The results of the experiment are as follows.
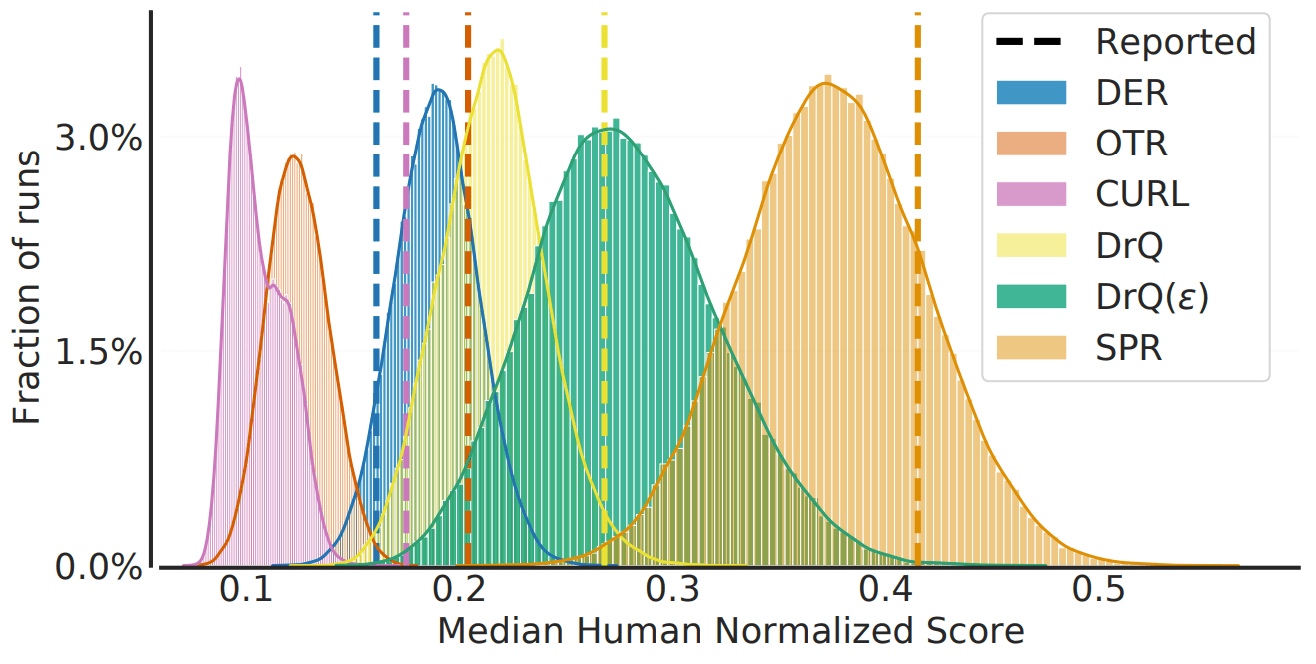
This figure shows the distribution of the medians obtained and the values reported in the paper. In general, it can be seen that there is a large variability in the sample medians obtained from a small sample and that comparisons based on point estimates may lead to erroneous conclusions.
Changes in evaluation protocols also have a significant impact on the comparison of algorithms.
Although it is typical to use the score of the last training episode to evaluate a reinforcement learning algorithm, the highest score during training or the score from multiple runs may also be reported. When we change the evaluation protocol of DER to that of CURL/SUNRISE, the results change significantly, as shown in the following figure.

Thus, in addition to the variability of point estimates under a small number of runs, changes in the evaluation protocol also have a significant impact on the accuracy of the evaluation of the reinforcement learning algorithm.
Recommendations and tools for reliable assessment
Increasing the number of runs to solve the aforementioned problem is not impractical due to the high computational load of the benchmark.
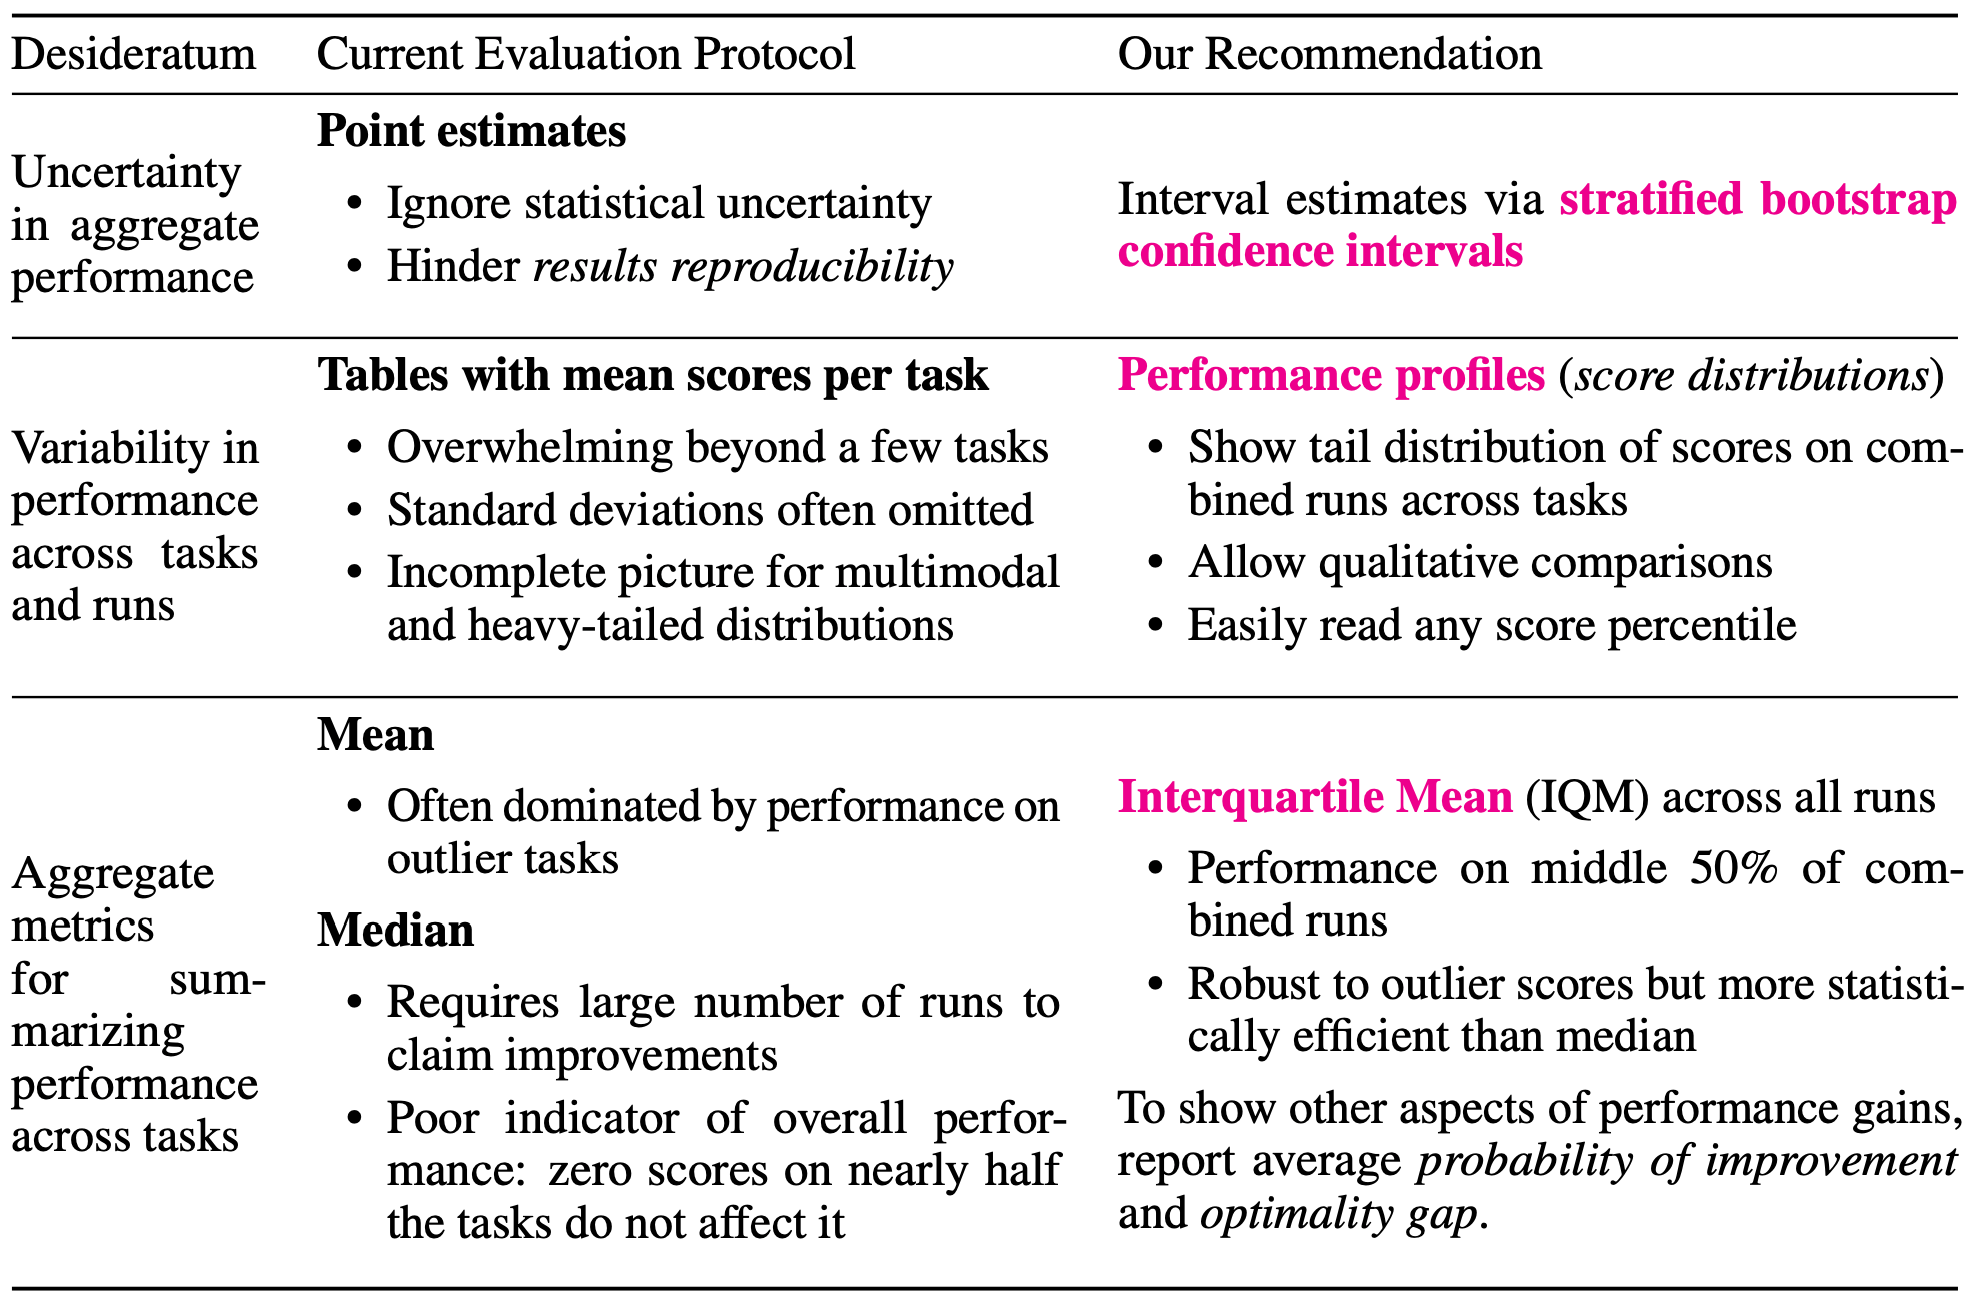
To solve this problem, the original paper proposes three tools for a reliable measure in the case of a small number of runs.
stratified bootstrap confidence interval
The first is to obtain confidence intervals using the bootstrap method with stratified sampling.
Since it is not useful to use the bootstrap method for the average score of a single task when $N$ is small, we sample among $N$ runs for each of $m$ tasks and obtain a confidence interval based on this.
performance profile
The second is to use the performance profile used to benchmark optimization software.
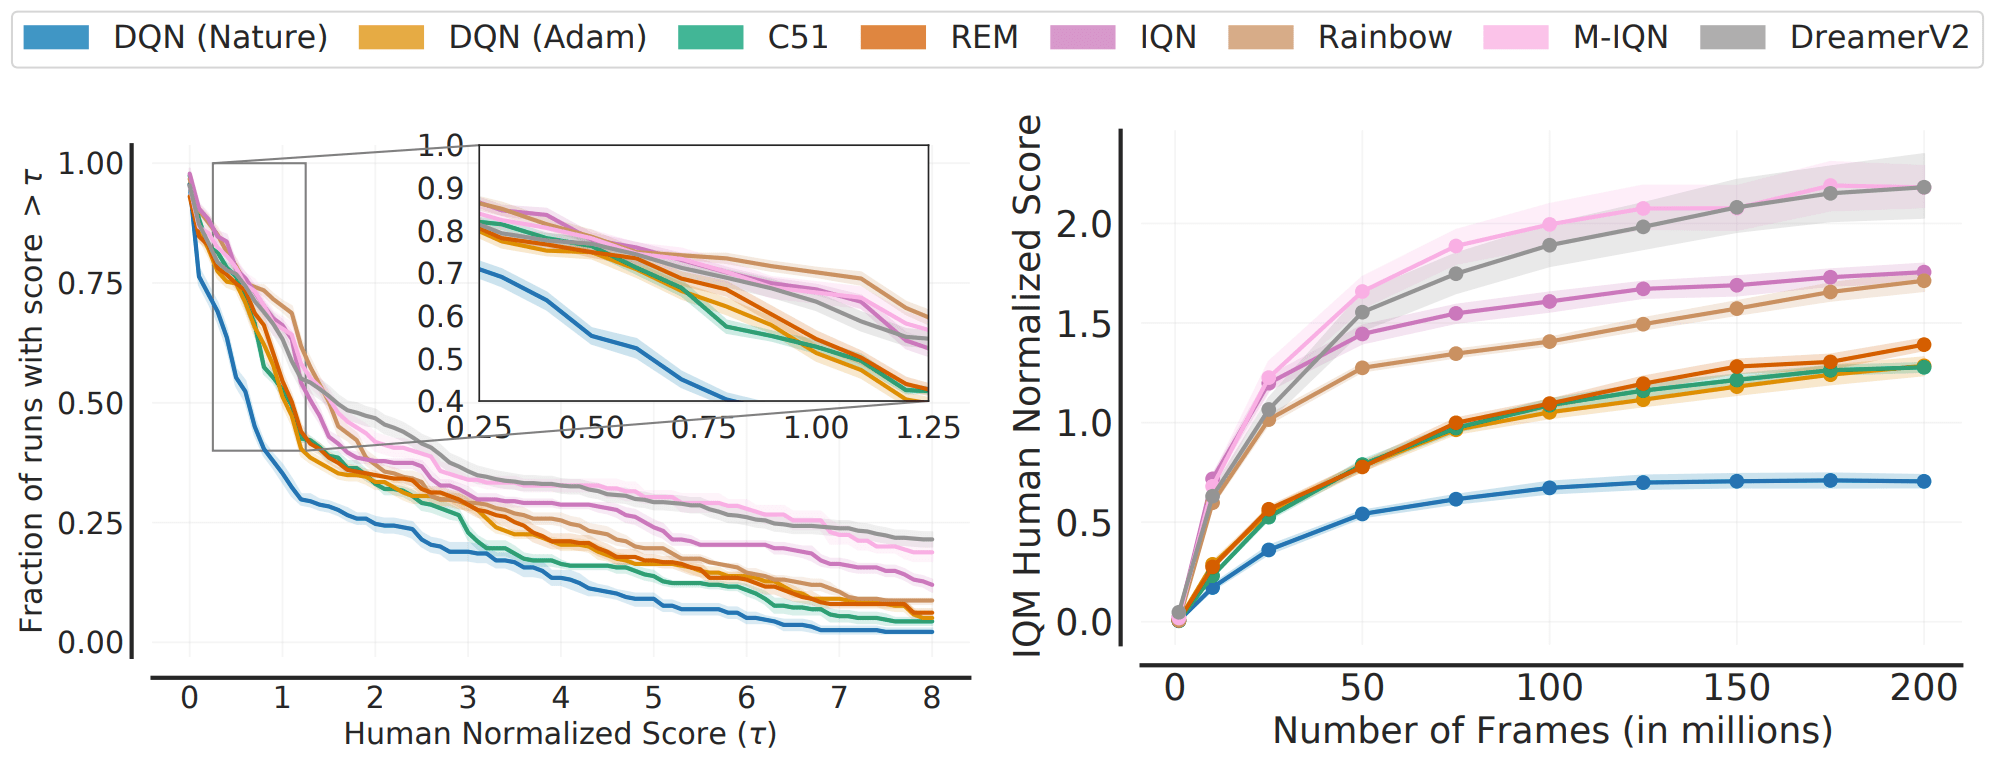
More specifically, it has been proposed to use a score distribution (or run-score distribution) that indicates the percentage of runs above a certain normalized score. This is given by the following equation
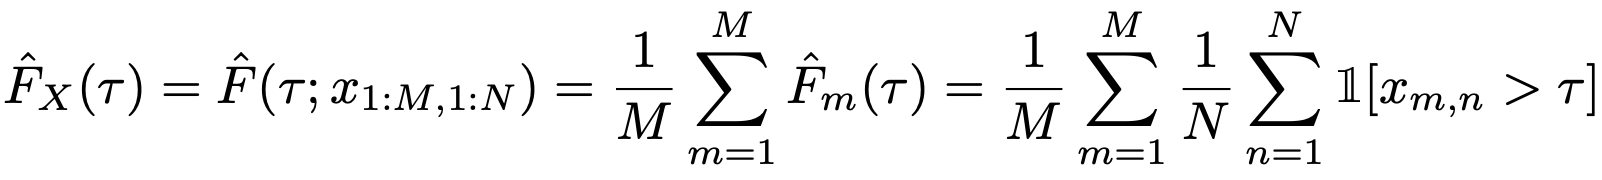
The actual comparison results are also shown below.
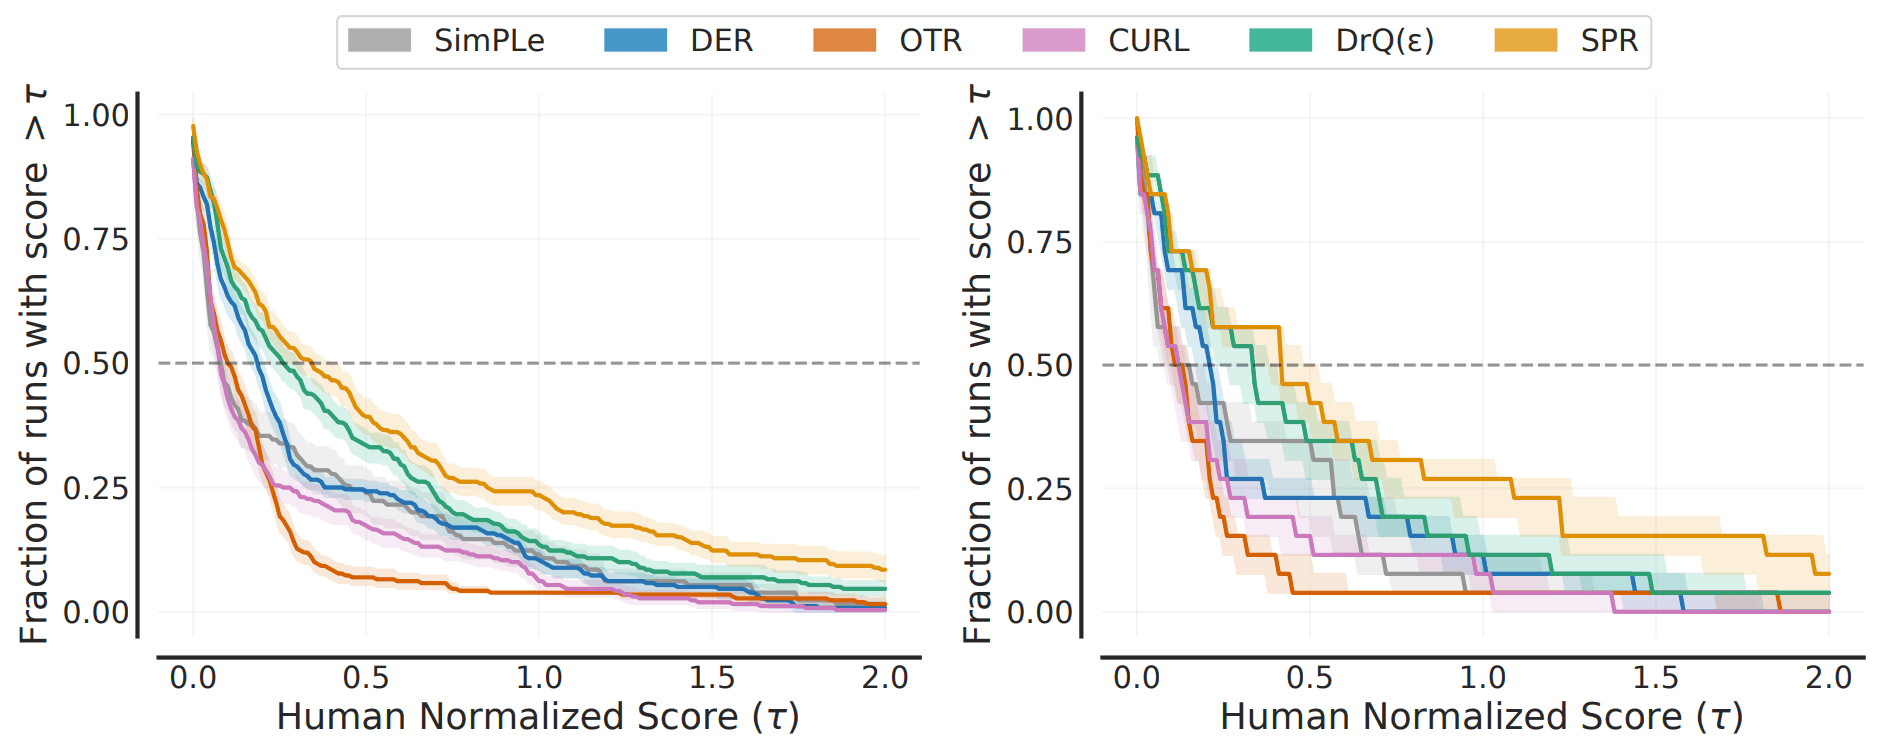
In this figure, the left side shows the score distribution and the right side shows the mean score distribution (the percentage of tasks that perform above a certain normalized score).
InterQuartile Mean (IQM)
With an index such as score distribution, it becomes difficult to determine which is dominant when two curves intersect at multiple points, for example.
Therefore, it is proposed to use the InterQuartile Mean (IQM) as an aggregate measure that can be used instead of the median. It is calculated by averaging over the remaining 50% of the population, excluding the bottom 25% and the top 25%.
The IQM is more robust to outliers and is a better measure of overall performance than the median, which is strongly dependent on the order between tasks. In fact, for the five reinforcement learning algorithms mentioned above, the 95% confidence intervals for the mean and IQM are as follows
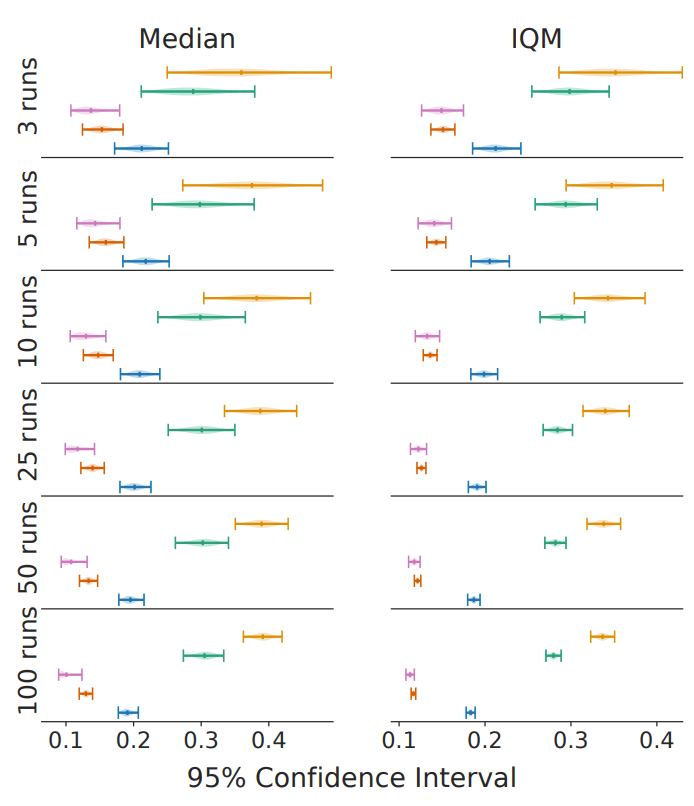
As shown in the figure, we can see that the uncertainty is kept small even when the number of trials is small.
On evaluation in deep reinforcement learning benchmarks
Finally, we discuss the evaluation of several existing deep reinforcement learning benchmarks.
Arcade Learning Environment (ALE)
The benchmark of learning for 200M frames in ALE is widely recognized. For this benchmark, we measure the performance of existing algorithms on various metrics as follows.
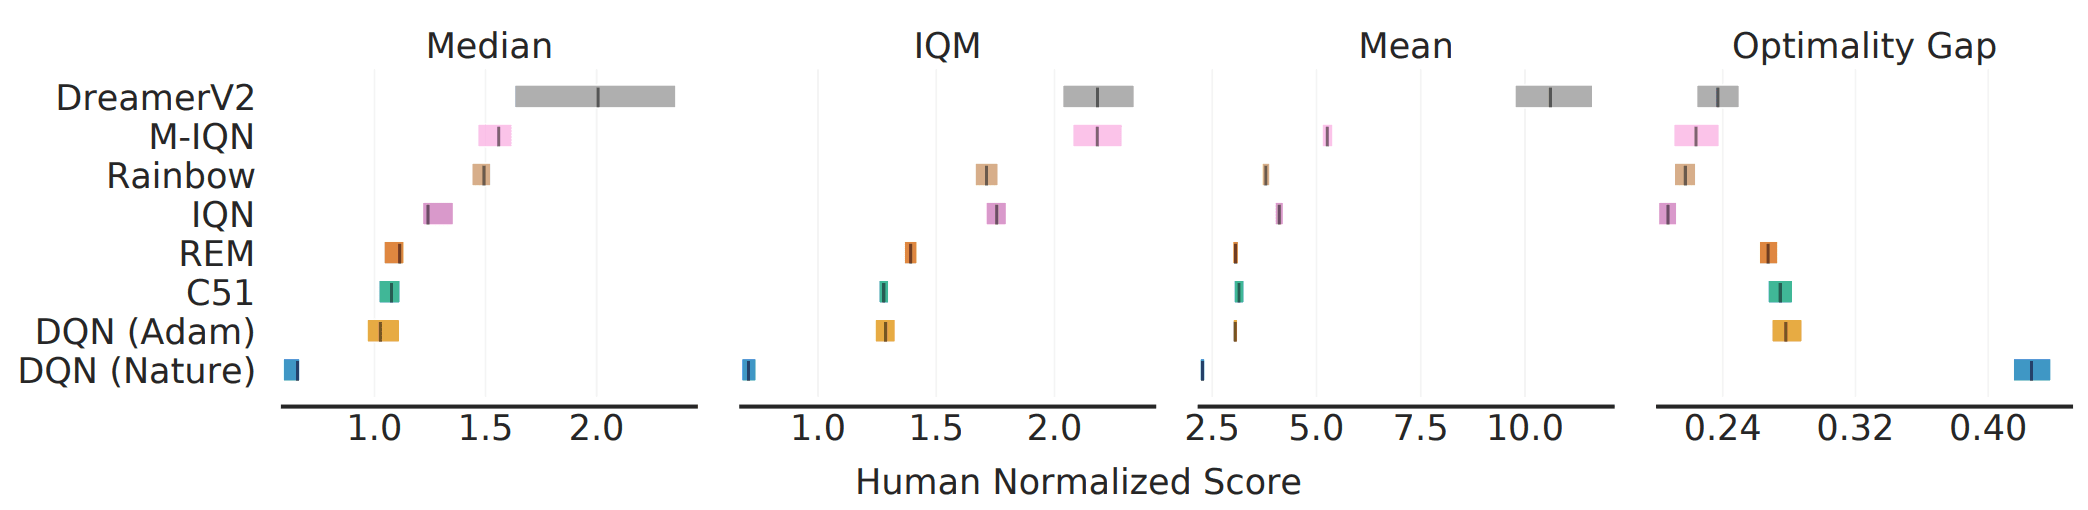
As shown in the figure, there are cases where the ranking between algorithms changes depending on the choice of metric (e.g., median vs. IQM). This shows that aggregate metrics do not capture all of the performance of the entire task/execution.
DeepMind Control Suite
Next, the results for DM Control, a continuous control task, are as follows.
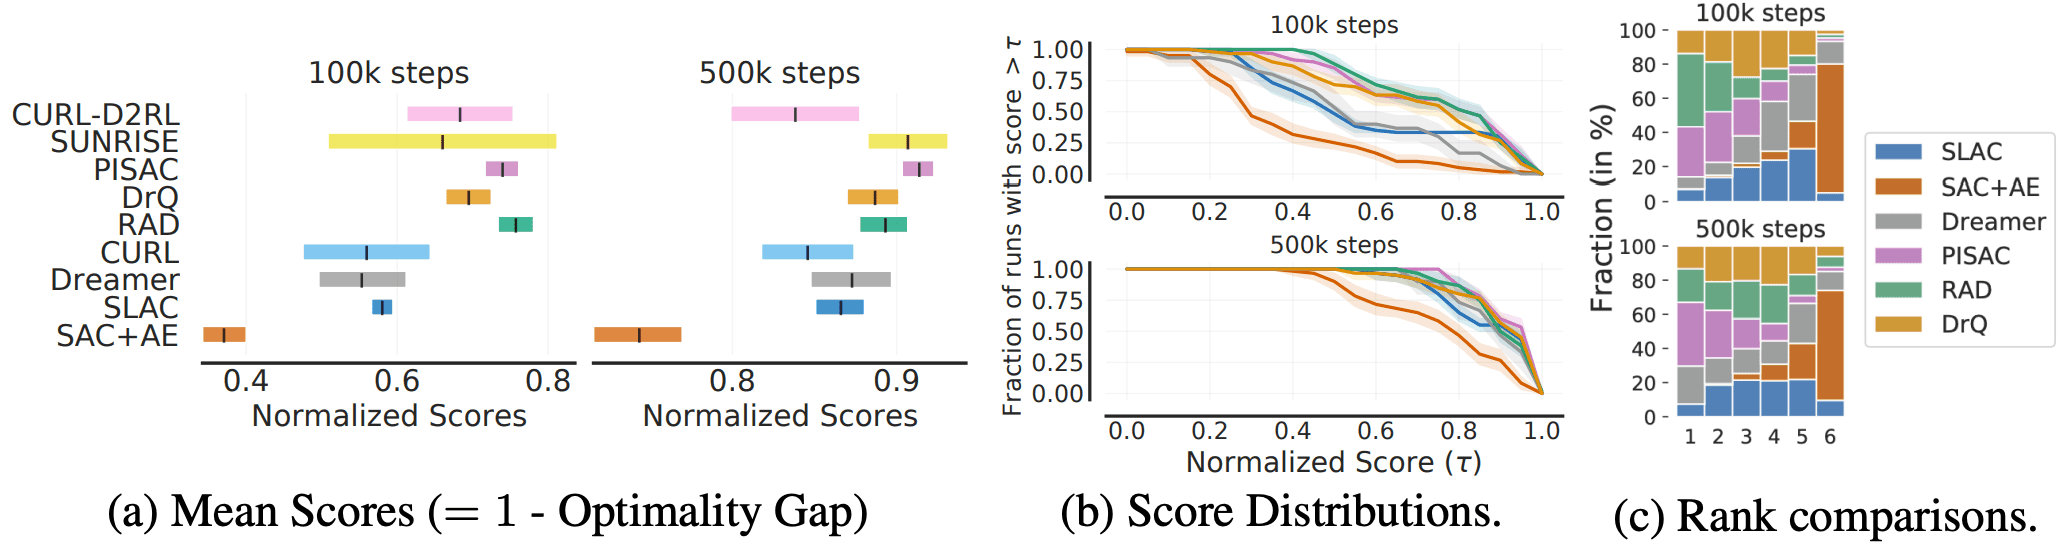
The algorithms in the figure are arranged in the order of relative performance claimed in the paper, but in reality, there is a large variation due to uncertainty and there may be a difference between the actual superiority and the reported performance.
summary
For deep reinforcement learning algorithms, it has been suggested that their reported performance is heavily influenced by bias and uncertainty. The paper describes metrics for reducing bias and uncertainty, as well as recommendations for reducing them.
Also, a library for more accurate evaluation and analysis of reinforcement learning is available. Please have a look at it together with the original paper.


Categories related to this article