
Time Series Data Clustering With Quantum Computing (annealing Machines)
3 main points
✔️ This is a co-authored paper on time series data clustering between a university in Japan and Fujitsu.
✔️ We use a quantum computer (an annealing machine) to achieve faster and more accurate time series data clustering.
✔️ We confirmed superior clustering properties on online distributed data set andflow measurement image data setcompared to two existing methods.
Clustering Method for Time-Series Images Using Quantum-Inspired Computing Technology
written by Tomoki Inoue, Koyo Kubota, Tsubasa Ikami, Yasuhiro Egami, Hiroki Nagai, Takahiro Kashikawa, Koichi Kimura, Yu Matsuda
[Submitted on 26 May 2023 (v1), last revised 18 Jul 2023 (this version, v3]
Comments: 13 pages, 4 figures
Subjects: Signal Processing (eess.SP); Computer Vision and Pattern Recognition (cs.CV); Fluid Dynamics (physics.flu-dyn)
code:
The images used in this article are from the paper, the introductory slides, or were created based on them.
summary
Time series clustering serves as a powerful data mining technique for time series data in the absence of prior knowledge about clusters. Large amounts of large time series data are acquired and used in various research fields. Therefore, clustering methods with low computational cost are in demand.
The special feature of this paper is that quantum computing techniques used in quantum computers (annealing machines) are applied to this clustering. Annealing machines outperform conventional computers in terms of solving combinatorial optimization problems with high speed and high precision, and are expected to realize clustering that is difficult to achieve with existing methods.
We propose a novel time series clustering method that utilizes an annealing machine. The proposed method facilitates the equal classification of time series data into clusters that are close to each other while maintaining robustness against outliers.
Furthermore, the method is applicable to time series images. We compared the proposed method with standard existing methods for clustering online distributed data sets. In existing methods, the distance between each data set is computed based on the Euclidean distance metric, and clustering is performed using the k-means++ method. Both methods were found to produce comparable results.
In addition, the proposed method was applied to a flow measurement image data set containing significant noise with a signal-to-noise ratio of approximately 1. Despite the small signal variability of about 2%, the proposed method effectively classified the data without overlap between clusters.
On the other hand, clustering results from existing standard methods and the conditional image sampling (CIS) method, a method specific to flow measurement data, showed overlapping clusters. The results showed that the proposed method outperformed the other two methods, demonstrating its potential as a superior clustering method.
Introduction.
Clustering is a powerful data mining technique for classifying data into related groups in the absence of sufficient prior knowledge about the groups. Especially when dealing with time series data, the clustering technique is called time series clustering. Much research has been done on time series clustering, which is summarized in the review article. (Paper citations 2,7-10) In addition, several libraries for time series clustering are available on the web and are widely used. Following this literature, time series clustering is defined as "the process of unsupervised partitioning of a given time series data set into clusters such that like time series are grouped together based on some specific similarity measure, which is called time series clustering."
Three main methods are commonly employed for time series clustering: raw database-based/shape-based, feature-based, and model-based. These methods differ in their initial computational steps. Raw database/shape-based approaches use raw data directly for clustering, while feature-based approaches convert raw data into low-dimensional feature vectors. The model-based approach assumes that the time series data are generated from a stochastic process model and that the model parameters are estimated from the data. When clusters are close together, the performance of the model-based approach is reduced, so the raw data base approach and the feature-based approach are usually used. Subsequent steps compute the similarity or distance between the two sets of data, feature vectors, and models.
Machine learning techniques are then used to group data into clusters based on measured similarities and distances. Commonly employed clustering algorithms for time series data include partitioning, hierarchical, model-based, and density-based clustering algorithms. Among the partitioned clustering algorithms, k-means clustering is one of the most widely used algorithms. Its main advantage is its low computational cost. However, this method requires a number of clusters that is pre-determined by the user. The hierarchical clustering algorithm does not require the number of clusters to be pre-determined. However, once clusters have been split or combined using the split or agglomeration methods, they cannot be adjusted. Neural network approaches such as self-organizing maps and hidden Markov models are used as model-based clustering approaches. In addition to the aforementioned drawback that the closer clusters are, the worse the performance, these approaches are computationally expensive. Density-based methods, such as density-based spatial clustering of applications with noise (DBSCAN), do not require a pre-determined number of clusters and are robust to outliers.
However, these methods are known to suffer from the curse of dimensionality due to the difficulty of proper parameter selection.
Proposed Method
In this study, we propose a new time series clustering method using annealing machines. Annealing machines, such as quantum annealing and simulated annealing, can solve combinatorial optimization problems faster and more accurately than conventional computers. Therefore, the proposed method is expected to accomplish clustering tasks that are difficult to accomplish with existing methods. One of the unique features of the proposed method is its ability to evenly classify time series data into closely related clusters while maintaining robustness against outliers. Furthermore, the method is specifically designed to equally classify periodic time series images into multiple phase ranges. This is because it assumes a sufficient number of images for each phase to account for the long duration of the time series data relative to the period.
For the clustering computation, we used Fujitsu's third-generation digital annealer (DA3), one of the quantum-inspired computation techniques; DA3 is capable of solving quadratic unconstrained binary optimization (QUBO) problems and the clustering problem can be formulated as an Ising model, which is equivalently a QUBO problem DA3 provides solutions in a large problem space of up to 100 kbits, one obtained from the "UEA & UCR time-series classification repository" and the other from the authors' previous data on the Kármán vortex The data consists of flow measurement image data capturing the STREET. The flow measurement data were chosen in particular because they are generally high-dimensional ( ~106 ) and contain measurement noise. For the clustering process, we employed a raw database and feature-based approach. In addition, we compared our results with those obtained from existing standard methods, in particular the "tslearn" available online, and the conditional image sampling (CIS) method (flow measurement data only).
Results and Discussion
Clustering of time series datasets available online
We have demonstrated the application of the proposed method to the classification of the "crop" dataset available from the UEA & UCR time series classification repository. "tslearn" "TimeSeriesKMeans" function and the clustering results using the proposed method are shown in Figure 1. The "crops" dataset contained 24 clusters. However, results for two representative clusters are shown here. In this dataset, the correct classification is known and displayed in Figure 1. In addition, we computed the ensemble average data for each method. As shown in Figure 1(a), the proposed method successfully classified the data, while the results obtained with the standard existing method (tslearn) showed unfavorable classification. Therefore, we calculated the root mean square error (RMSE) of the classification results obtained by the proposed method and tslearn. The RMSEs of the proposed and existing methods, shown in Figure 1(a), were 0.013 and 0.015, respectively. This further confirms that the proposed method outperforms the standard existing method. On the other hand, the RMSEs of the proposed and existing methods shown in Figure 1(b) were 0.013 and 0.009, respectively. Under these conditions, the proposed method was inferior to the existing method. However, as shown in Figure 1(b), classification is inherently difficult due to the large variance of the correct answer data. Therefore, we can conclude that the proposed method provides results comparable to the existing method.
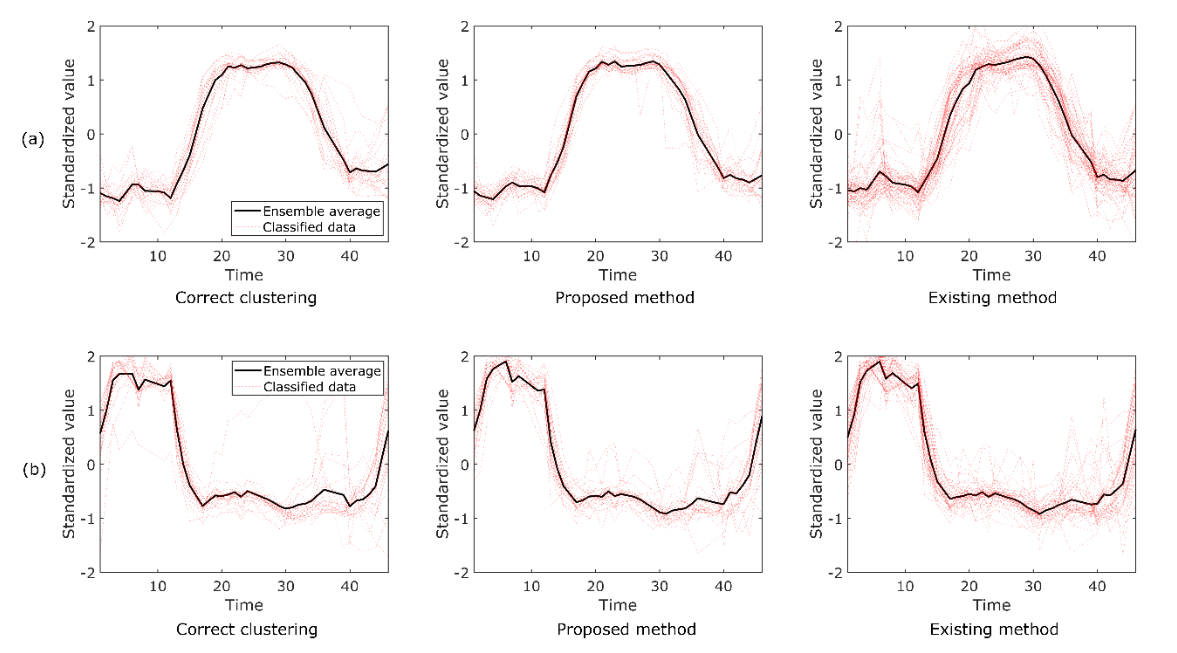
| Figure 1. typical clustering results of the proposed and existing methods on the "crop" dataset from the UEA & UCR time series classification repository. Data labeled as class 1 and class 17 in the repository are shown in (a) and (b), respectively. |
Clustering of flow measurement time series datasets
In this study, the method was applied to a flow measurement data set to demonstrate its effectiveness for noisy data. A typical snapshot of the data is shown in Figure 2, and the image shows that it contains significant noise with a signal-to-noise ratio of approximately 1.
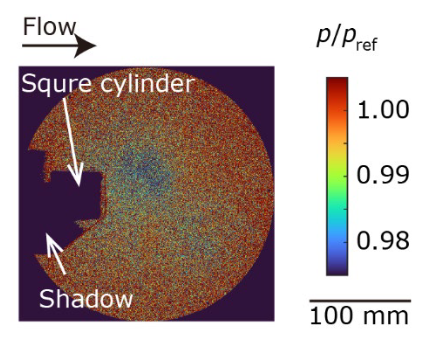
| Figure 2. pressure 𝑝 is normalized by atmospheric pressure 𝑝; Inoue et al. |
In this study, this time-series data was classified into nine clusters using the proposed method "tslearn" and the CIS method. The clustering results are shown in Figure 3, where the data are presented in a two-dimensional scatterplot using the multidimensional scaling (MDS) method; in the MDS calculation, the distance between data 𝐱𝑖 and 𝐱j is represented as 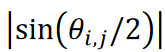 , where |a | represents the absolute value of a,
  is corresponds to the angle between data vectors 𝐱𝑖 and 𝐱j. Since the Kármán vortex street data set used here is a periodic phenomenon with a single maximum distance, the data were distributed along a circle of radius 1/2. As shown in Figure 3, the proposed method successfully classified the data without duplication.
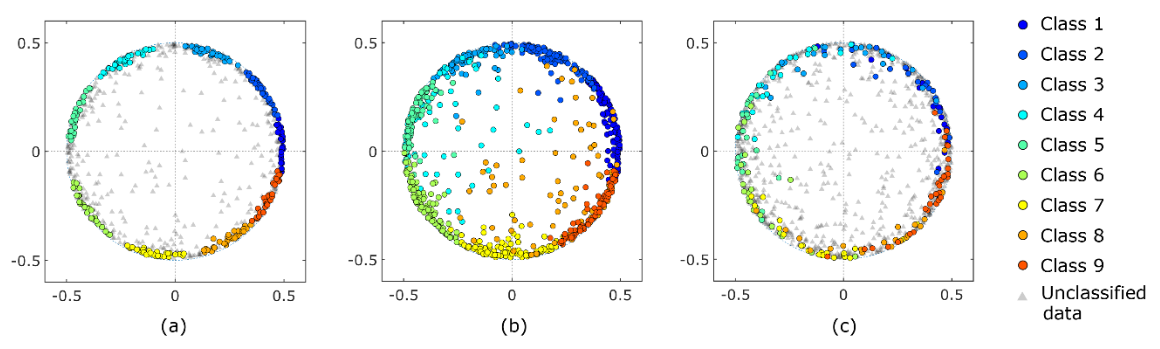
| Figure 3. 2D scatter plots by MDS. (a) results from the proposed method, (b) results from the existing standard method (tslearn), and (c) results from the CIS method. |
Data points were equally classified into each cluster and the clusters were similar in size to each other. Data points that fell outside of the 1/2 radius circle were considered outliers because these data were considered disturbances that deviated from periodic phenomena. However, standard existing methods classified the outliers into one of the clusters. This is inappropriate when calculating ensemble averages of the data; the CIS method only classifies data on the circle. However, some clusters exhibited overlapping regions and did not form separate clusters. Density-based methods such as Density-Based Spatial Clustering of Noisy Applications (DBSCAN) are known as powerful clustering methods. However, DBSCAN classified the data points on the circle into a single cluster.
The ensemble-averaged pressure distribution is shown in Figure 4. The proposed method (Fig. 4a) and the CIS method (Fig. 4c) extract periodic vortex development well, even though the pressure fluctuations are as small as 2%. On the other hand, the pressure distribution obtained by the standard method fails to extract periodic motions accurately. For example, the vortex located on the upper side suddenly disappeared from phase 2 to phase 3, and the vortex located on the upper side reversed flow direction from phase 5 to phase 6 (Figure 4b). This discrepancy is attributed to the overlapping of the clusters observed in Figure 3b. Since the pressure decreases with the onset of the vortex, the minimum pressure at the center of the vortex was compared between the proposed method and the CIS method. The ensemble mean pressure is p/pref = 0.982 ± 0.001 for the proposed method and p/pref = 0.984 ± 0.002 for the CIS method, where error is standard deviation and pref is atmospheric pressure. This difference indicates that in the CIS method, the eddies are weakened by the aforementioned overlapping clusters, since data from different phases are also included in the ensemble averaging process. These results provide further evidence that the proposed method is a powerful clustering technique for analyzing periodic phenomena.
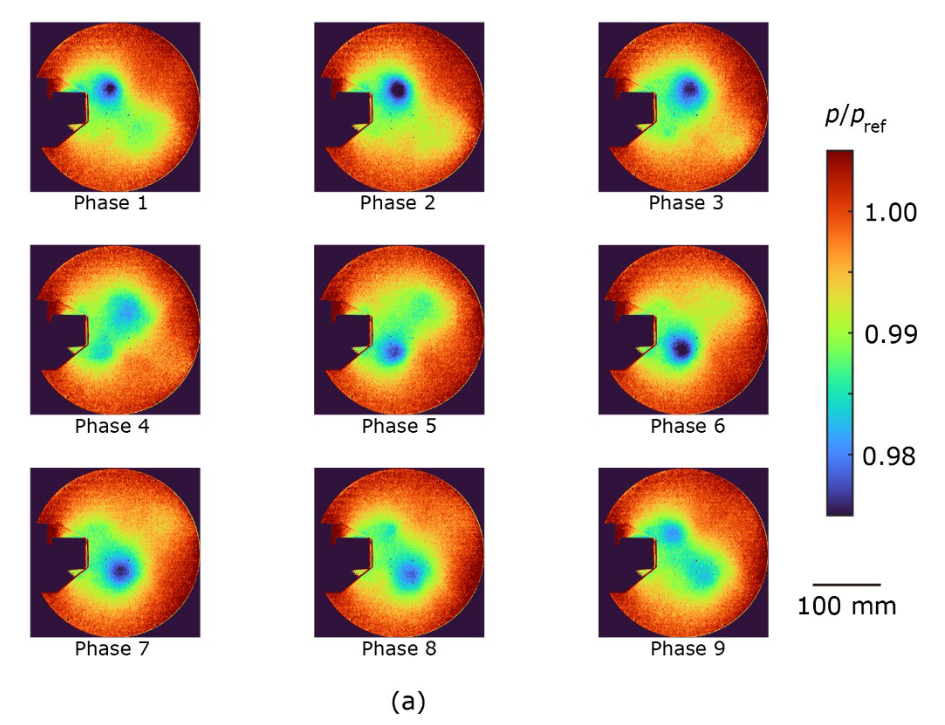
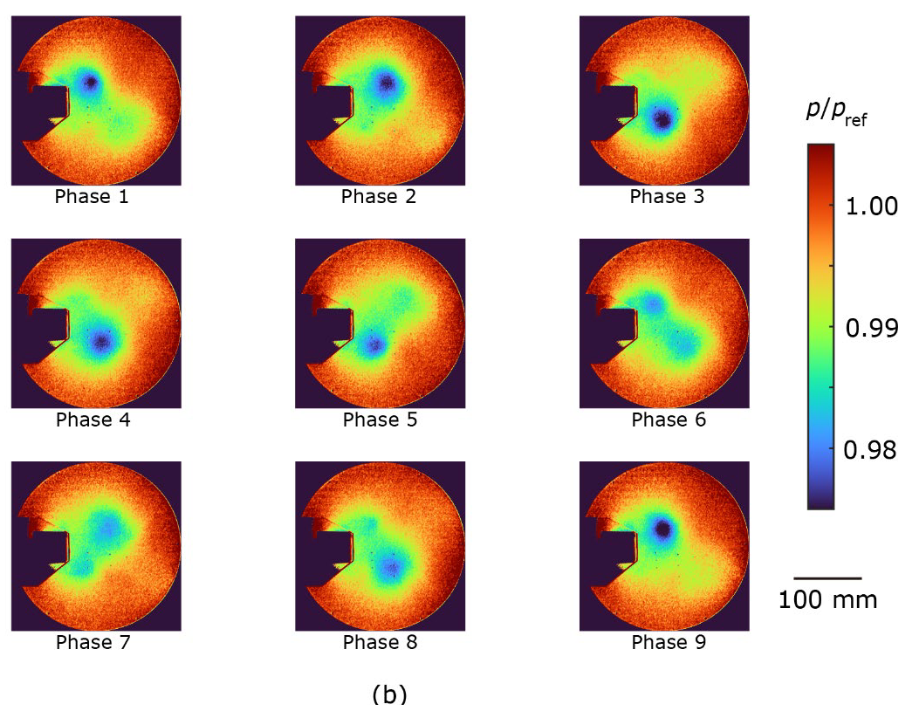
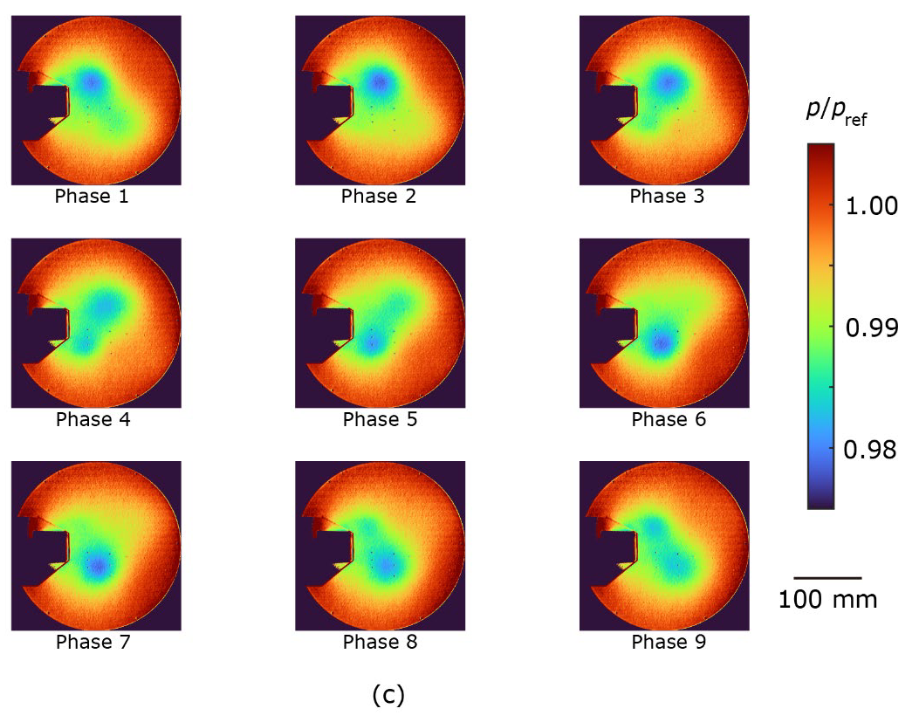
| Figure 4. Ensemble mean pressure distributions for (a) the proposed method, (b) the existing standard method (tslearn), and (c) the CIS method. Pressure p is normalized by atmospheric pressure pref. |
Materials and Methods
Proposed method for time series clustering
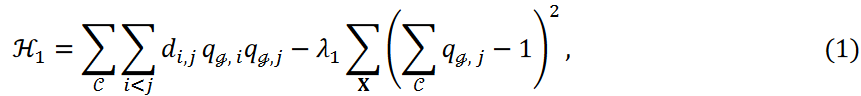
We propose a new clustering method using an annealing machine. We focus on raw database and feature-based approaches in time series data analysis. The Hamiltonian of the clustering problem is described as follows
WHEREAS.
The similarity or inverse of the distance between 𝐱i and 𝐱𝑗 is denoted as 𝑑𝑖,𝑗 and λ1 is the hyperparameter. The sum  represents the sum of the inverses of the similarities or distances between two data points belonging to a cluster. The sum ∑𝒞 represents the sum over all clusters of the first term in Equation 1. Clustering is minimized with
  ,
,
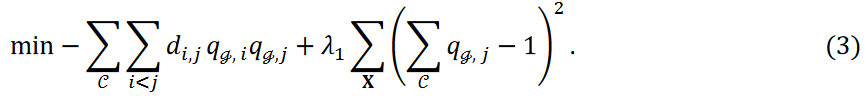
The second term in Equation 3 represents the constraint term that guarantees that data points belong to only one cluster. The value 𝜆1 determines the severity of this constraint; the smaller the value, the more likely some data points will be treated as outliers and not assigned to any cluster. The following minimization problems were considered in this study
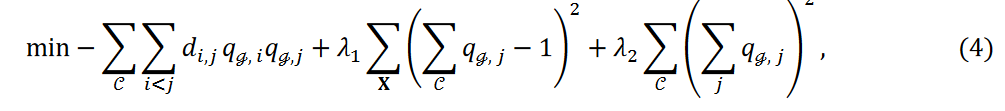 Here, the new third term in Equation 4, the new term, adjusts the number of data points classified into each cluster. For notational simplicity, we denote this as
  to indicate the number of data points belonging to cluster Cℊ. The third term in Equation 4 is then written as
The mean number and variance of data points belonging to each cluster are represented by 𝜇 and 𝜎2, respectively. Equation 5 is written as
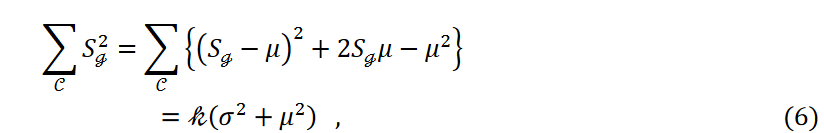
Here, the number of data points 𝑛 and the number of clusters k are fixed and  is a constant. Then, as the variance decreases, i.e., as the third term in Equation 4 decreases, the data points are equally classified into each cluster.
Time series data set for demonstration
The proposed clustering method was applied to two time series datasets. One of the datasets was named "crop" and was obtained from the UEA & UCR time series classification repository.
These time series data are derived from images taken by the FORMOSAT-2 satellite. The dataset consists of 24 classes corresponding to agricultural land cover maps, each corresponding to its temporal evolution. The "TimeSeriesKMeans" function from "tslearn" was used in this study. The parameters of this function were 24 for the number of clusters, Euclidean for the metric (distance between each data), k-means++ for the initialization method, and default values for the other parameters. This is a standard time series clustering method. The proposed method also used the Euclidean distance as a metric and used the inverse of the metric to minimize the first term in Equation 4. The parameter 𝜆1 was set to be approximately 100 times larger than 𝜆2, since all data points in this data set must belong to one of the clusters. Under these conditions, we obtained a solution where all data points belong to one of the clusters (the second term in Equation 4 is 0).
The second data set used in this study was flow image data obtained from measurements using the pressure-sensitive coating (PSP) method; PSP is a pressure distribution measurement technique based on oxygen quenching of phosphorescence emitted from a dye incorporated into the PSP coating. The data measured was the pressure distribution caused by the Kármán vortex street behind the square cylinder. The data size is a 780 x 780 spatial grid. The flow velocity was 50 m/s and the Reynolds number was 1.1 x 10⁵. Due to the small variation in phosphorescence intensity, the pressure difference was too small to detect the PSP method. And the measured pressure contained significant noise, which needs to be reduced from the data. It is well known that the Karman vortex is a periodic phenomenon. To reduce the noise and extract significant patterns, one of the goals of time series clustering, the data were classified into several phase groups and averaged within these groups. Because of the focus on eddy phase information, a cosine similarity measure was used to assess the similarity between the data; since the PSP data are time series image data with two spatial and one temporal dimension, the pressure distribution data were reformatted into a column vector. The resulting time series PSP data is written as 𝑛 time series data 𝐱 = {𝐱1, 𝐱2 ⋯ , 𝐱𝑛}, where 𝐱𝑖 is the vector corresponding to the reshaped pressure distribution. Since the measured PSP data contain significant noise, the denoised data were used for the similarity calculations. Following the literature, a less noisy data set can be obtained by considering the truncated singular value decomposition (SVD) Where the data matrix Y is obtained by arranging the vectors 𝐱𝑖 in a time series, expressed in SVD:

where the matrices 𝐔 and 𝐕 are unitary matrices and the superscript ⊤ indicates transposition. Matrix Σ is a diagonal matrix of singular values in descending order. It is well known that data can be approximated by a truncated SVD as follows

Where  is the first diagonal matrix and 𝑟 × 𝑟 is the truncated rank. The matrices
  and
and  are the reduced matrices corresponding to . We then obtain the noise-reduced time series data matrix
  or the time series data
  . We assume r = 5, which is a commonly used truncation value. The cosine similarity cos 𝜃𝑖,𝑗 was then calculated as follows
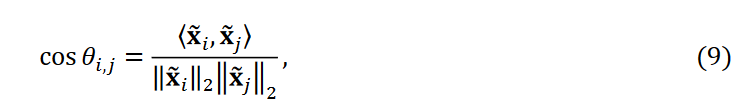
where  is the inner product of
  and
and  and
and  is the ℓ2 norm of
  . In this study, only the pressure distribution behind the prism was considered to reduce computational cost. We substituted
  into Equation 4 and calculated the clustering using DA3. The parameter λ1 was set to be several tens of times larger than λ2, so that each term in Equation 4 would be of similar magnitude. Under these conditions, some data were classified as outliers. Images within the same cluster were ensemble averaged to extract significant patterns. Note here that the original image data X was averaged to extract patterns and the dataset at
  was not used.
Considering that cos 𝜃𝑖 ,j ranges from -1 to 1, we introduced the following relation 𝑟𝑖 ,𝑗 that ranges from 0 to 1
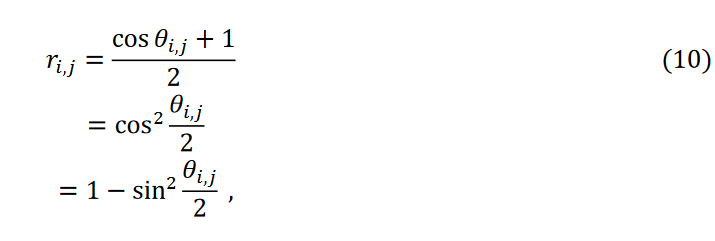
where 1 - ri,j = 0 when i = i (same data). The distance metric between the data is then defined as  , where |𝑗| represents the absolute value of 𝑗 and θi,j represents the angle between the data vectors. In this distance metric, the maximum distance is unity. This distance metric was used to calculate the data sheet.
The time series data were also classified by the "TimeSeriesKMeans" function in "tslearn" described above. In addition, we used the CIS method, which is specific to PSP measurements; the CIS method classified the time series data into several phase groups based on the pressure data measured by the pressure transducer sensor, a point sensor with a higher sampling rate than the PSP. In other words, the CIS method requires an extra sensor for clustering. This reliance on extra sensors can be considered one of the limitations of the CIS method.
Conclusion.
We proposed a new clustering method using an annealing machine. We added a new term to the QUBO model that adjusts the number of data classified into each cluster. We have two datasets: one is the "crop" dataset available from the UEA & UCR time series classification repository, and the other is the flow measurement image dataset from our previous study. For clustering the "crop" dataset, we employed an existing standard method distributed as "tslearn". In this method, the distance between each dataset is computed based on Euclidean distance and the clustering is computed by the k-means++ algorithm. Comparing the results of the proposed and existing methods, it is observed that the proposed method has a smaller scatter of data points than the existing method. Correct clustering results were obtained for this data set. We then computed the ensemble averaged data and compared the root mean square error (RMSE) between the correct data and the ensemble averaged data. The results showed that both methods provide similar results for this data set.
The proposed clustering method was then applied to a flow measurement image dataset consisting of a time series of pressure distributions caused by the Kalman vortex. Periodicity was observed in this data set. Another feature of this data set is that it contains significant noise, with a signal-to-noise ratio of approximately 1. For comparison, this data set was also classified using standard existing methods and a conditional image sampling (CIS) method specifically designed for flow measurement data. The proposed method successfully classified the data without overlap between clusters, despite the small pressure variation of approximately 2%. On the other hand, both the existing method and the CIS method showed overlapping clusters and failed to form discrete clusters. The existing method showed a large overlap between clusters, and in the ensemble-averaged pressure distribution, the vortices suddenly disappeared in some cases, while in other cases they exhibited backflow. In the ensemble-averaged pressure distribution obtained by the CIS method, the vortex weakened. These results emphasize the superior performance of the proposed method in clustering periodic phenomena.


Categories related to this article