Are Cost Indicators Necessarily Appropriate?
3 main points
✔️ Discuss the pros and cons of various cost metrics
✔️ Discuss when discrepancies arise between cost indicators
✔️ Discusses when comparisons using cost metrics are no longer fair
The Efficiency Misnomer
written by Mostafa Dehghani, Anurag Arnab, Lucas Beyer, Ashish Vaswani, Yi Tay
(Submitted on 25 Oct 2021 (v1), last revised 16 Mar 2022 (this version, v2))
Comments: ICLR2022
Subjects: Machine Learning (cs.LG); Artificial Intelligence (cs.AI); Computation and Language (cs.CL); Computer Vision and Pattern Recognition (cs.CV); Machine Learning (stat.ML)
code:
The images used in this article are from the paper, the introductory slides, or were created based on them.
first of all
The efficiency of machine learning models is a very important factor in the development and use of models.
For example, the cost of inference is directly related to the ease of use of the model in practice and the limitations of the available hardware. The economic and environmental impact of the cost of training a model is also an important consideration. Therefore, there are many measures of model efficiency, such as the number of parameters to train, the number of floating-point operations (FLOPs), and the speed/throughput.
However, not all of these efficiency indicators are covered, and there are many cases where only some indicators are reported, for example, only the number of parameters and FLOPs. However, is it appropriate to judge model efficiency based on only some of the indicators of model efficiency?
This article describes research that has investigated various aspects of this issue, including the strengths and weaknesses of commonly used model cost measures and the risks of making decisions based on some measures.
About Cost Indicators
To begin, we introduce various cost metrics for the efficiency of machine learning models.
FLOPs
FLOPs is a commonly used measure as a proxy for the computational cost of a model and indicate the number of floating-point multiplication and addition operations (number of floating-point operations). It is a different index from FLOPS (Floating-point Operations Per Second), which is used as an index of computer processing speed.
It should be noted that the FLOPs reported in the paper are calculated according to theoretical values, which ignores practical factors such as which processes in the model can be parallelized.
Number of Parameters
The number of learnable parameters is used as an indirect measure of computational complexity. Many studies on the Scaling Law, especially in the NLP domain, use the number of parameters as a key cost metric.
Speed
Speed is one of the most useful metrics for comparing the efficiency of different models. When measuring speed, the cost of the pipeline may be taken into account to reflect the actual setup.
Naturally, speed depends on the hardware and implementation used, so it is important to either fix the hardware or normalize based on the resources used for comparison.
There are several forms of reported speed indicators, including
- Throughput: the number of examples or tokens ("examples per second" or "tokens per second") processed in a specific time.
- Latency: The inference time ("seconds per forwarding pass") of the model given a given example or batch of examples. This is important for real-time systems that require user input, for example, because the parallelism introduced by batch processing is ignored.
- Wall-clock time/runtime: the time taken for the model to process a certain set of examples. Often used to measure training costs, such as total training time until model convergence.
- Pipeline bubble: The amount of time a computing device is idle at the start and end of each batch. It is an indirect measure of the speed of the non-pipeline portion of the process.
- Memory Access Cost: Number of memory accesses. It is usually a large part of the runtime and is the actual bottleneck when running models on GPUs, TPUs, etc.
These cost indicators reflect various aspects of model efficiency.
However, these metrics are not necessarily specific to the model design, but depend on various factors such as the hardware on which the model runs, the framework implemented, and programming skills.
For example, while FLOPs are hardware-independent, they do not necessarily lead to model speed.
On the other hand, throughput and memory usage, which better reflect model efficiency in real-world environments, are highly hardware and implementation-dependent. Thus, the fact that each cost metric depends on different factors leads to the difficulty of comparison. In the following sections, we will discuss the efficiency metrics of the models, focusing on the number of parameters, FLOPs, and speed.
Possible discrepancies between cost indicators
Next, we discuss possible discrepancies between the cost measures discussed earlier.
Parameter Sharing
In the case of a model with parameter sharing, the number of trainable parameters is reduced while the FLOPs and speed remain the same compared to a model without parameter sharing.
For example, the following is a comparison of a Universal Transformer that shares parameters with a vanilla Transformer, etc.
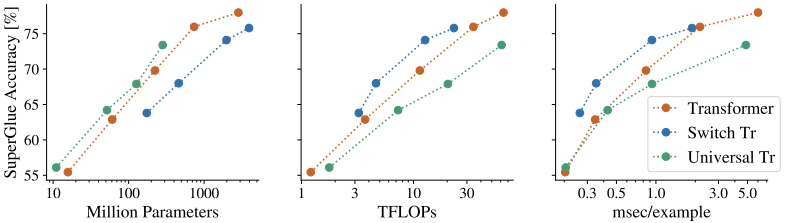
Looking only at the number of parameters (left in the figure), the Universal Transformer appears to be more efficient than the other models. However, when looking at FLOPs and throughput (middle and right of the figure), the relative ranking of the Universal Transformer drops. Thus, the number of parameters is not a valid cost metric for models that share parameters.
Introducing sparsity
When sparsity is introduced into a neural network, there can also be discrepancies in the cost metric.
When using a subset of different weights in the neural network depending on the input examples, for example, Mixture of Experts (MoE), the number of parameters can be very large, but the FLOPs for quality can be improved. FLOPs can also be significantly reduced for (sparsified) models where the operations are allowed to include many zeros (or near-zero values).
The previous figure shows the case of a switching transformer using MoE, and although the number of parameters for quality is not favorable, the comparison between quality, FLOPs, and speed shows very good results.
It should also be noted that while sparse models can lead to a large theoretical reduction in FLOPs, they are unlikely to lead to a significant increase in speed.
For example, MoE incurs additional overhead due to the routing part of which parts of the model to use, difficulty in using batch processing effectively, etc. Also, even in the case of models where operations are allowed to include many zeros, the efficiency of low-level arithmetic operations cannot be made equivalent to the corresponding dense computations due to the significant cost of memory access.
Degree of parallelism: a comparison of model depth and width scaling
If you want to change the model size, the simplest way is to change the depth (number of layers) and width (number of hidden dimensions) of the model.
Now, if we investigate how the various cost metrics and model accuracy change when the depth (D) and width (W) of the Vision Transformer are changed, the results are as follows.
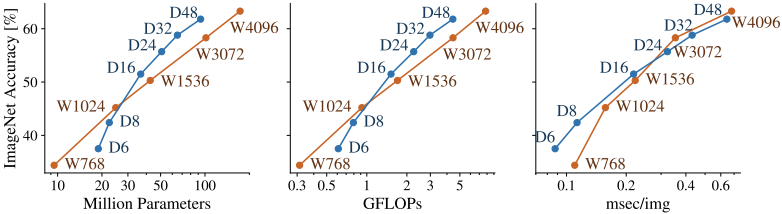
In this figure, considering the number of parameters and FLOPs, it can be concluded that increasing the width in the low-cost region and increasing the depth in the high-cost region will improve the performance with less cost.
However, a different trend can be seen in the speed (msec/img).
For example, comparing W3072 and D48, judging from the number of FLOPs and parameters, D48 seems to show better performance at a comparable cost.
However, when comparing speeds, we cannot judge W3072 to be worse than D48 (due to more parallel processing). Thus, there are cases where different degrees of parallelization lead to inconsistent results between cost metrics.
Target Platforms and Implementations
Hardware and implementation may also cause discrepancies in cost metrics.
For example, GPUs and TPUs may show different degrees of improvement in speed efficiency when implementing techniques to reduce model costs. Also, global average pooling instead of CLS in ViT can significantly reduce the memory cost of TPU-V3, but this is due to the TPU specification. Thus, there exist cases where hardware and implementation can affect the cost metric of the model.
consideration
In machine learning communications, cost metrics are primarily used to
- Compare the efficiency of different models using cost metrics.
- Compare the quality of different models at the same cost setting.
- Select a model that is an appropriate trade-off between quality and cost (e.g., NAS).
Using cost metrics for these purposes can sometimes lead to inaccurate conclusions.
Efficiency comparison of different models
First, we consider (1) when comparing the efficiency of different models by cost indicator.
The following figure shows the comparison of FLOPs, number of parameters, execution time, and accuracy for different models.
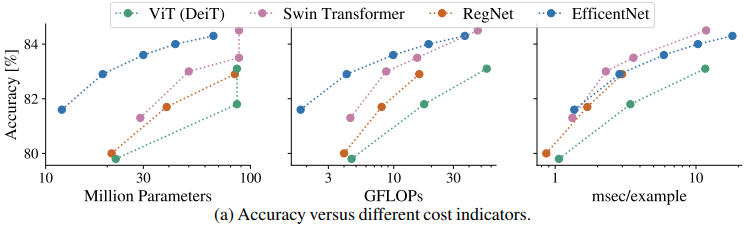
Looking at these model accuracy - cost indicator relationships, the relative relationship of each model depends on the cost indicator.
For example, looking at the number of parameters and FLOPs, EfficientNets shows a good trade-off. However, in the accuracy-throughput graph, SwinTransformer appears to be better.
Thus, the optimal model may differ depending on which cost indicator is used for comparison. The following plots show the correlations between cost indicators.
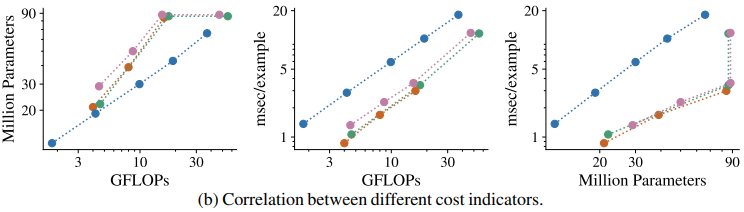
The figure shows that EfficientNet keeps the number of model parameters smaller than the other models when FLOPs is fixed.
On the other hand, looking at the throughput for FLOPs, we see that EfficientNet has poorer throughput than the other models. In addition, for the Transformer-based model, even though the number of parameters is the same, the other metrics vary significantly.
This is because the input resolution of the model has changed (from 224x224 to 384x384) and the number of input tokens to the encoder is different. Conversely, it can be seen that changes in model settings may only have a significant impact on some cost metrics.
Quality comparison of different models
Next, we consider (2) the case of comparing the quality of different models at the same cost setting.
In this case, two patterns are mainly used, one is the comparison with the same number of parameters in the model and the other is the comparison with the same computational cost such as FLOPs.
Problems when comparing the same number of parameters
First, we consider the potential problems of comparing models with the same number of parameters.
Token-free model
In the token-free model, modeling is done at the character or byte level, not at the token level.
In this case, many parameters derived from the embedding matrix are removed, which makes a fair comparison with the non-token-free model very difficult.
Sparse Models and Mixture-of-Expert
As mentioned earlier, for models that use sparsity, it is unfair to compare models with the same number of parameters.
In the previous example, if you compare a Switch Transformer and a vanilla Transformer with the same parameter settings, the vanilla Transformer will always have the advantage.
Vision transformer and sequence length
In models like Vision Transformer, where the length of the sequence can be varied, it is possible to create architectures with very different computational costs (FLOPs and speed) for the same number of parameters. Therefore, this type of model should not be compared by the number of parameters.
For example, the following table shows the cost indicator of ViT for different patch sizes (sequence lengths).
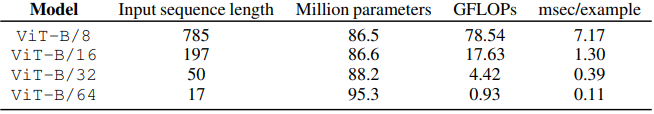
As shown in the table, there exist cases in which the number of parameters is the same in some models but the other indices change significantly.
Problems when comparing the same computation cost
On the other hand, problems may also arise when comparing models with identical computational costs.
For example, consider the case where the proposed method reduces the computational complexity in a way that does not affect the number of parameters in the model. If we want to make a comparison with the baseline, we may want to reduce the number of layers or hidden dimensions of the baseline until the computational complexity matches.
In this case, however, the baseline is handicapped by a simple reduction in the number of parameters, which leaves the model significantly short of capacity.
For example, in Perceiver IO, the baseline BERT is reduced to 20M parameters and 6 layers in the computationally matched comparison. Note that the maximum number of parameters and number of layers for the proposed method in the comparison is 425M and 40, respectively. In general, it is a non-trivial and difficult problem to make fair comparison by matching computational quantities.
Where a fair comparison cannot be easily made, it is recommended that best efforts be made to find the most appropriate comparison setting and, where possible, to indicate more than one candidate.
Cost Indicators in the NAS
In NAS, cost indices are often added to the loss function as a model resource constraint.
For example, the number of parameters, FLOPs, memory access cost, and real latency is used. As has been shown, cost metrics can lead to different conclusions from each other, so great care must be taken when choosing a cost metric during architecture exploration.
summary
In this article, we introduced a paper that provides an extensive discussion of the pros and cons of various cost measures and when differences between cost measures may arise.
Recent studies often compare different models based on cost metrics such as the number of parameters and FLOPs.
However, each indicator has various advantages and disadvantages, and there are cases where it is difficult to use them for a fair evaluation. Therefore, a comparison should be made using all available cost indicators.


Categories related to this article