Are Labels Always Necessary To Evaluate The Accuracy Of Classification Models?
3 main points
✔️ Propose a method to predict classification model accuracy on unlabeled test sets
✔️ Learned a regression model to predict classification accuracy from statistics of the dataset
✔️ Demonstrated accuracy estimation on an unlabeled test set
Are Labels Always Necessary for Classifier Accuracy Evaluation?
written by Weijian Deng, Liang Zheng
(Submitted on 6 Jul 2020 (v1), last revised 25 May 2021 (this version, v3))
Comments: CVPR 2021.
Subjects: Computer Vision and Pattern Recognition (cs.CV)
code:
The images used in this article are from the paper, the introductory slides, or were created based on them.
first of all
In image recognition and other computer vision tasks, a labeled test set is used to evaluate the performance of a model.
However, unlike typical benchmarks that come with pre-labeled test sets, it may be difficult to prepare such labeled test sets if we want to use the model in reality.
For example, if you want to use a model trained on synthetic data by a simulator as a training set in the real world, it may be difficult to prepare a real-world labeled test set.
In the paper presented in this article, we propose a method (AutoEval) to estimate the performance of a model on an unlabeled test set to address this problem.
This problem setup is summarized, for example, in the following figure
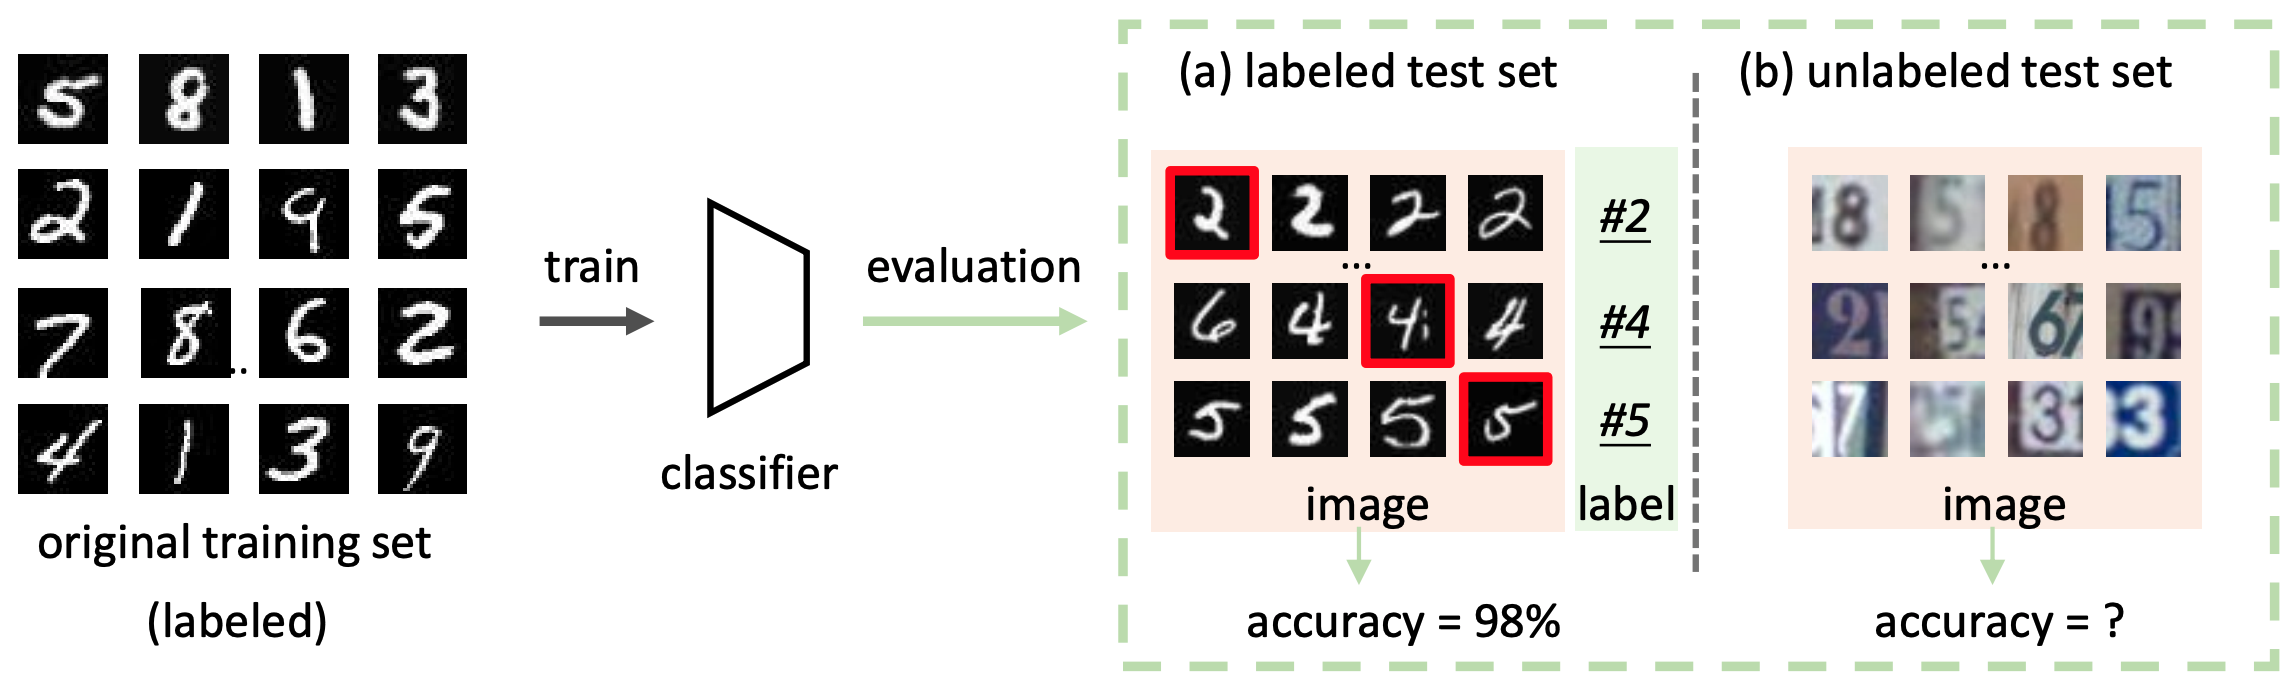
The goal of AutoEval is to evaluate the performance of the classification model on the unlabeled test set, as shown in (b) of the figure.
On the Correlation between Distributional Shift and Classification Model Accuracy
The proposed method, AutoEval, aims to evaluate the performance of classification models on unlabeled test sets. The AutoEval is based on the finding that the distribution shift between the training and test sets has a strong negative correlation with the accuracy of the classification model.
This is illustrated in the following figure
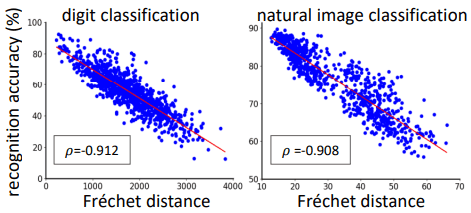
In this figure, the Fréchet distance (FD), which shows the deviation of the distribution between the training set and the test set for digit classification and natural image classification, is shown on the horizontal axis and the classification accuracy is shown on the vertical axis.
As shown in the figure, there is a strong negative correlation between the Fréchet distance corresponding to the magnitude of the distribution shift and the classification accuracy, and in fact, the Spearman's rank correlation coefficient $rho$ is about -0.91. In addition, actual examples in numerical image classification are as follows.
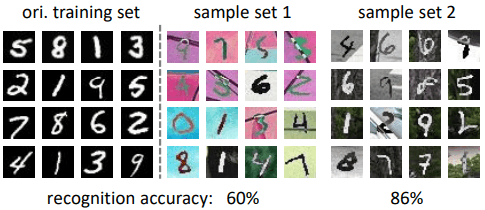
In this figure, the classification accuracy is 60% for sample set 1, whose distribution differs greatly from the training set, and 86% for sample set 2, whose distribution deviation is relatively small.
This suggests that information about the distribution of the dataset, such as the magnitude of the distribution shift between the training and test sets, can be used to estimate the classification model accuracy on the unlabeled test set.
Proposed method (AutoEval)
Formulation of AutoEval
Based on the aforementioned findings, AutoEval aims to predict the accuracy of the classification model based on the differences in distribution between the training and test sets.
Specifically, we learn a regression model $A:(f_{\theta}, D^u) \rightarrow a$ that predicts the accuracy of the classification model from the data set, considering the data set as a sample and the accuracy of the classification model for that data set as a label ($f_{\theta} is the classification model, $D^u={x_i}$ is the unlabeled data set, and $a$ is an estimate of the accuracy of the classification model).
Let us assume that there are $N$ sample data sets, and denote the $j$th sample data set $D_j$ as $(f_j,a_j)$.
$f_j$ is some vector representation for the dataset $D\j$, and $a_j \in [0,1]$ is the classification accuracy of the classification model $d_{\theta}$ for $D_j$.
At this point, the goal of AutoEval is to learn the regression model $A$, which is represented by the following equation
$a_j=A(f_j)$
To train this model, we use the standard squared loss function.
$L=\frac{1}{N}\sum^N_{j=1} (\hat{a_j}-a_j)^2$
$hat{a_j}$ is a prediction of the classification accuracy of $A$ for $D_j$.
After training this model, we obtain an estimate of the classification accuracy by $a=A(f^u)$ for the vector representation $f^u$ corresponding to the unlabeled test set $D^u$.
About AutoEval
To train AutoEval based on the aforementioned formulation, three designs need to be made as follows
- Data set representation $f_i$.
- Regression model $A$.
- A set of $N$ samples (metadata set) for training regression models
Let's look at each in turn.
On data set representation $f_i$ and regression model $A$.
linear regression model
As a simple example of a regression model $A$, we introduce the following linear regression model
$a_{linear} = A_{linear}(f) = w_1f_{linear}+w_0$
In this case, $f_{linear}$ denotes the representation of the sample set $D$, and $w_0,w_1$ denote the parameters of the linear regression model. Also, $f_{linear}$ represents the Fréchet distance (FD: Fréchet distance) between the training set $D_{ori}$ and the sample set $D$, which is given by the following equation.
$f_{linear} = FD(D_{ori}, D)$
$= ||\mu_{ori}-\mu||^2_2 + Tr(\Sigma_{ori}+\Sigma-2(\Sigma_{ori}\Sigma)^{\frac{1}{2}}})$
In this case, $mu_{ori},\mu$ are the mean feature vectors of $D_ori,D$, respectively, and $\Sigma_{ori},\Sigma$ are the covariance matrices.
These are obtained by computing the image features in $D_ori,D$ by the classification model $f_{\thteta}$ trained on $D_ori$.
the neural network regression model
Apart from the linear regression model, we also consider the regression model using neural networks.
It is expressed as $a_{neural} = A_{neural}(f_{neural})$ and uses a simple all-coupled neural network for the architecture of the regression model.
Also, for the representation $f_{neural}$ corresponding to the data set, it is defined as follows using the mean vector of the data set \mu$, the covariance matrix $\Sigma$, and $f_linear$ as described above.
$f_{neural}=[f_{linear}; \mu; \sigma]$
Since the covariance matrix $\Sigma$ is high-dimensional and difficult to learn, we use $\sigma$, which is reduced in dimension by the weighted sum of each row of $\Sigma$.
On the metadata set used for training regression models
Training the aforementioned regression model requires a sample data set and corresponding classification accuracy.
Ideally, then, the sample set should be sufficiently diverse that the test set is included in the distribution of the metadata set.
To build such a metadata set, we synthesize diverse data sets.
Specifically, we perform various transformation processes on the seed data set $D_s$ (which has the same distribution as D_{ori}) sampled from the same source domain $S$ as the training set $D_{ori}$ to generate the sample set $D_j$.
The conversion process is divided into the following two stages
- Background transformation: randomly crops a randomly selected image from the COCO dataset and replaces it as the background.
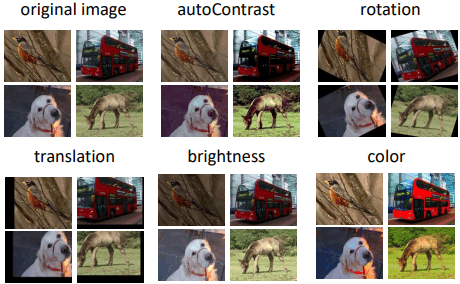
- Image transformation: randomly selects and combines three of the six image transformation processes (autoContrast, rotation, color, brightness, sharpness, translation: see AutoAugment ) and transforms each sample to a different size for each sample.
An example of the image conversion process is shown below.
An example of the actual sample set generated looks like this
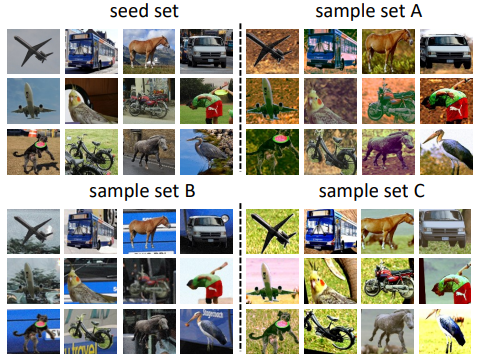
Since the labels of these sample sets inherit directly from the seed set, it is possible to predict the classification accuracy for each of them.
Therefore, for each sample set generated by the above procedure, we predict the classification accuracy using the classification model $f_{\theta}$ trained on the training set $D_{ori}$, and use it as the sample $(f_j,a_j)$ for the regression model.
confidence-based method (baseline)
As a simple baseline for the evaluation of AutoEval, we introduce an intuitive solution based on the assumption that if the output of the SoftMax layer is large (≈Confidence is large), then the prediction is likely to be correct.
Specifically, if the output $s_i$ of the SoftMax layer of the classification model $f_{\theta}$ is larger than the threshold $\tau$, we consider that the classification for image $x_i$ was done correctly.
$a_max=A_max(f_{\theta},D^u)=\frac{\sum^M_{i=1}[max(s_i) >\tau]}{M}$
$M$ is the number of images in $D^u$.
Experiment setup
We experiment with AutoEval on two classification tasks: numeric classification and natural image classification. The experimental setup for each is as follows.
Numerical Image Classification Task
- Original training set $D_{ori}$: MNIST's train set
- Seed set for metadata set generation $D_s$:MNIST test set
- Test set: USPS, SCHN
- Number of sample sets: train set 3000, validation set 1000
- Architecture : LeNet-5
The COCO train set is used for background substitution during sample set generation.
the natural image classification task
- Original training set $D_{ori}$: COCO's train set
- Seed set for metadata set generation $D_s$:validation set for COCO
- Test set : PASCAL, Caltech, ImageNet
- Number of sample sets: train set 1000, validation set 600
- Architecture: ResNet-50 pre-trained on ImageNet
The COCO test set is used for background replacement during sample set generation.
In addition, for each dataset, 12 common classes (aeroplane, bike, bird, boat, bottle, bus, car, dog, horse, monitor, motorbike, person) are selected for use (the person class is limited to 600 images). class is limited to 600 images).
experimental results
For each of the three aforementioned methods (confidence-based method, linear regression model, and neural network regression model), the results of the experiments are as follows.
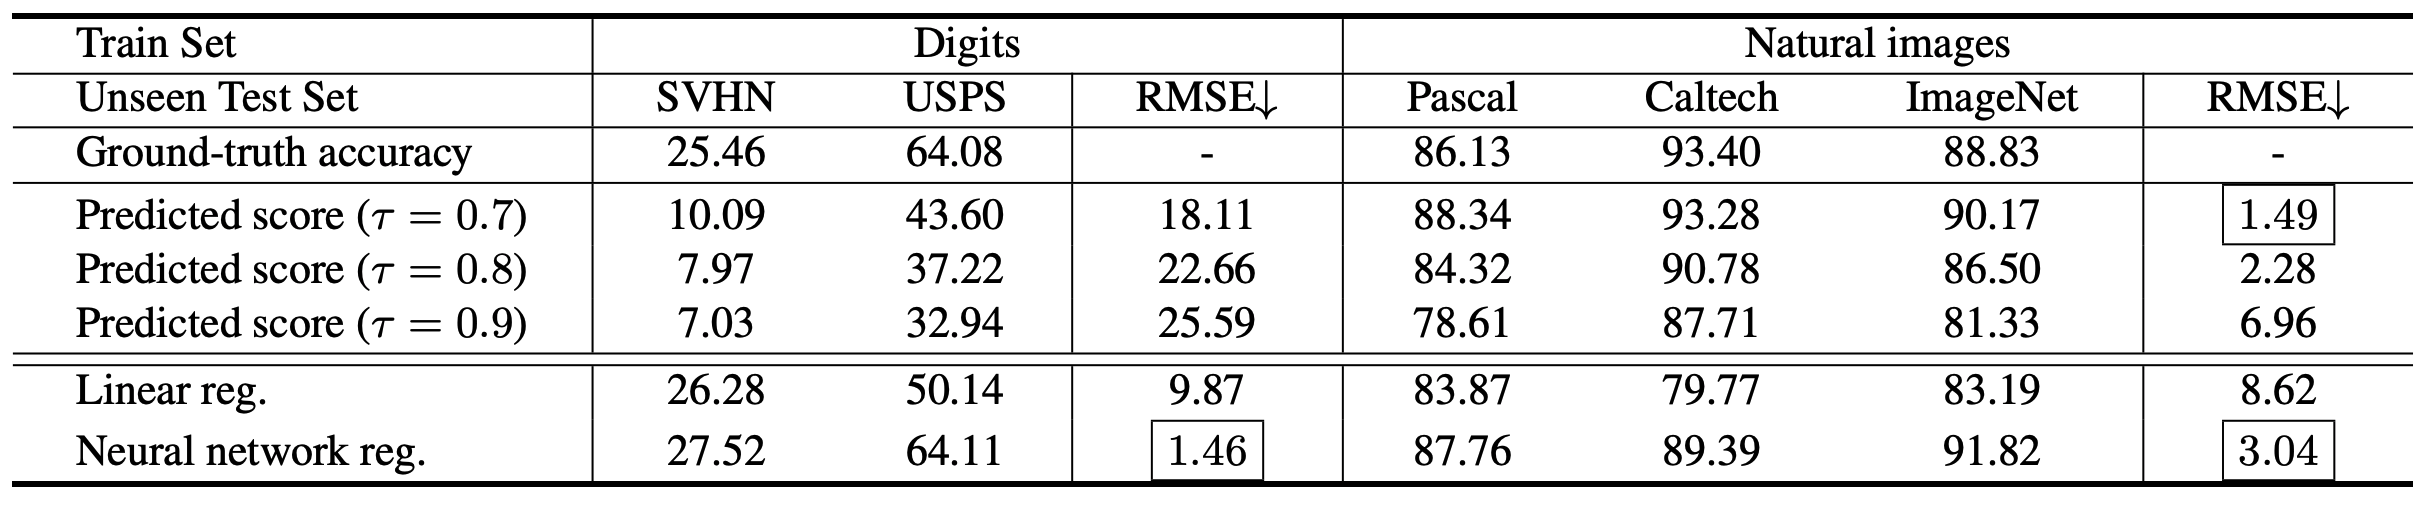
It can be seen that the confidence-based method is sensitive to the threshold value and the RMSE (the smaller the better) changes, and the performance is very low for numeric image classification, whereas AutoEval (Linear reg./Neural network reg.) works stably.
Also, the linear regression model is significantly inferior in the Caltech dataset, which may be due to the linear regression model being affected by the simpler background of the Caltech dataset.
Comparison of linear regression/neural network regression models
To validate the two regression methods, the results of comparative experiments with image transformation on natural image datasets (PASCAl, Caltech, and ImageNet) are as follows.
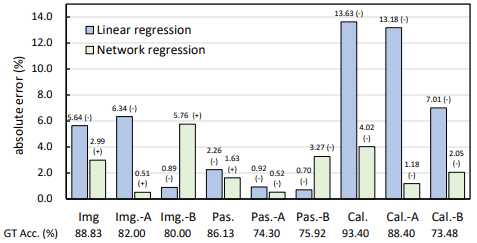
The image conversion process is indicated by "-A" and "-B".
We found that the linear regression model performed well except for the Caltech dataset, and the neural network regression model performed consistently well.
About Metadata Sets
The results of investigating the impact of the size of the metadata set (number of sample datasets) and the size of the sample dataset (number of images in the sample dataset) on the regression model are shown below.
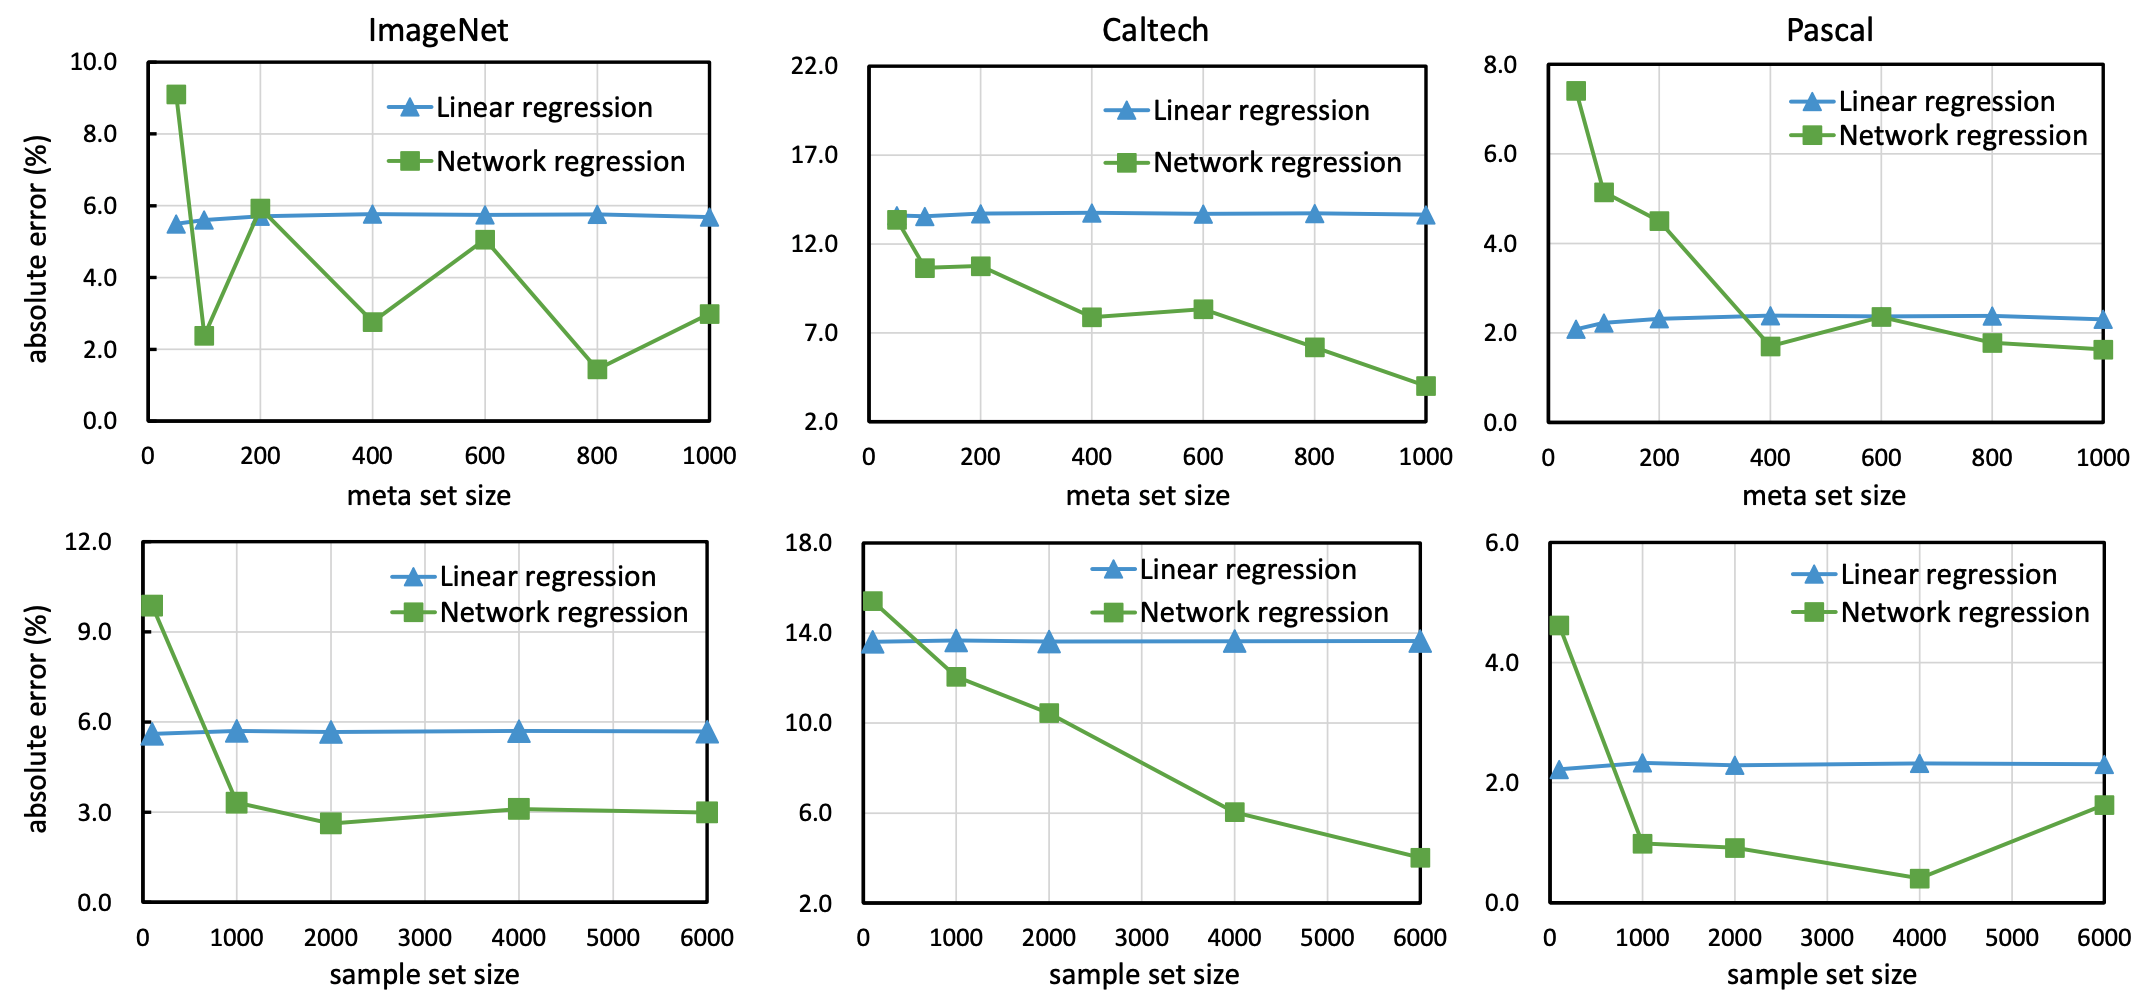
In general, we found that the linear regression model performs stably even with a small number of data, while the neural network regression model performs best when the metadata set/sample data set size is somewhat large.
summary
The paper presented in this article addresses the novel problem of predicting the classification accuracy of a test set in the absence of labels.
The proposed method, AutoEval, achieves some success on this problem by creating synthetic sample data sets through background substitution and image transformation processes and learning a regression model that predicts the classification accuracy for each sample set.
However, (1) because the metadata set relies on synthetic data, it may not function well depending on the distribution of the test set, (2) there may be other valid representations of the data set other than the mean and covariance, and (3) although the FD score is used to measure the similarity between the data sets (3) Although the FD score is used to measure the similarity between data sets, there may be other effective criteria.


Categories related to this article