How Is AI Used In Economic And Financial Market Forecasting? Introducing Network Topology-based Enterprise Performance Forecasting!
3 main points
✔️ Paper on corporate bankruptcy risk and performance forecasting
✔️ Uses topological features of networks based on product similarity
✔️ Use in combination with financial information to improve accuracy
Topology of products similarity network for market forecasting
written by Jingfang Fan, Keren Cohen, Louis M. Shekhtman, Sibo LiuJun MengYoram LouzounShlomo Havlin
(Submitted on 28 Aug 2019)
Comments: Applied Network Science volume 4, Article number: 69 (2019)
Subjects: Machine Learning (cs.LG); Machine Learning (stat.ML)
First of all
This will be an introduction to a paper on one of the main issues in economic forecasting: the detection and prediction of risk in financial markets.
It's a bit of an old paper, posted in 2019, and the technology itself isn't new, but it's an area we haven't covered much here at AI-Scholar, so I thought I'd introduce it here.
I'm sure there are a lot of people who work with AI and are interested in stocks and economic forecasting, but I think this will give you an idea of the atmosphere of how AI is used in the field of financial and economic forecasting and what kind of data is used.
About Network Science
Network science has proven to be a useful tool in the study of many real-world systems, as it has been used to predict many natural and technological phenomena, such as epidemics of infectious diseases, predictions of urban development, predictions of climate extremes, and changes in the influence of scientists.
The network science approach has also been applied in the field of finance (e.g., describing the instability of financial systems, studying the relationship between financial network structure and failures due to risk contagion).
The constructed network will be analyzed by examining various indicators such as
- Local Features
- which basically count the frequency of subgraphs
- e.g., degree, small-scale motifs, cluster coefficients, etc.
- hierarchical index
- Basically measures the position of a node in the network if the network were ordered according to some hierarchical mechanism
- centrality index
- Each network feature reflects a different type of correspondence between the similarity of products of different firms
- E.g. proximity centrality, K-cores, K-shell, etc.
In the last few years, there have also been efforts to combine networks and machine learning to predict classes of nodes and entire networks. There are also some interesting ideas on how to generate features from networks, such as node2vec (example below: details omitted).
- Eigenvectors of the adjacency matrix of the network
- DeepWalk
- spectral-based convolution
- node2vec
- and so on
Here, an important perspective in feature generation is to use more complex features of the topology, rather than simply using the graph as a similarity measure. While many existing approaches have neglected the topological features of graphs, we have recently found that topological features from graphs provide a very good characterization of nodes and edges and are useful for classification problems. The authors also propose to predict the performance of a company using a topology-based method.
Proposed method
Now we will start to explain the proposed method. The authors propose a method that combines text analysis, network theory, and topology-based machine learning.
The specific steps in the process are. First, the product descriptions of the companies listed in the SEC Form 10-K are analyzed on a text basis to construct a network of product similarities among the companies. We consider the companies as nodes in the network, and the similarity between the products of the companies is represented by the links (strength) of the network. Then, we use the topological features of the constructed network to predict the performance and bankruptcy risk of the companies by machine learning.
Let's start by explaining what kind of data we are using.
Data: Product similarity data
As data, the annual reports of companies called Form 10-K compiled by the U.S. Securities and Exchange Commission (SEC) are useful. In this paper, we use the product descriptions issued by the companies among them and calculate the product similarity by conducting text-based analysis.
Specifically, we first take the list of unique words used in product descriptions in each year from Form 10-K and build a database for each year. Next, we take the text from each company's product description and construct a binary N-dimensional vector that summarizes the usage of the word (1 if the word is used, 0 otherwise). It is like creating a Bow for each company. The vector obtained in this way is normalized, and the similarity is calculated by taking the cosine similarity between companies. In this study, we use data for 18 years (from 1996 to 2013).
Traditionally, traditional industry classifications such as SIC codes have been used as a reference, but this has not changed over time and in practice, the assignments are not accurate as companies can have various product segments belonging to different sectors. With that said, the authors also argue that the proposed similarity index is superior.
Data: External financial data
Apart from product similarity, the data for constructing financial variables is also presented.
For example, we download the daily closing price of the S&P 500 index from the Center for Research in Security Prices (CRSP), which can be used to measure overall market dynamics. To control for the range of observed firm characteristics, we also use several firm-specific variables to determine firm size. Specifically. The work of Fama and French et al. As proposed in Firm size is defined as the sum of the following indices We assume that firm size is the sum of the market capitalization
- Book-to-Market Ratio
- The book-to-market ratio is the ratio of book value to net assets at market value, which can be used to evaluate a company's growth opportunities.
- leverage
- A measure of the capital structure defined as the ratio of long-term debt and other debt (current liabilities) to the sum of long-term debt, debt in current liabilities, and shareholders' equity
- profitability
- Defined as profit before exceptional items on total assets delayed
- Previous year's return
- Stock returns for the past year
- investment
- Year-on-year growth in total assets
- liquidity
- A measure of a company's liquidity
- Altman Z-score
- Default Risk Index
Details on how to obtain each indicator can be found in the references of the paper. The data can also be downloaded from the Compustat database (http:/www.compustat.com).
Building a product similarity network
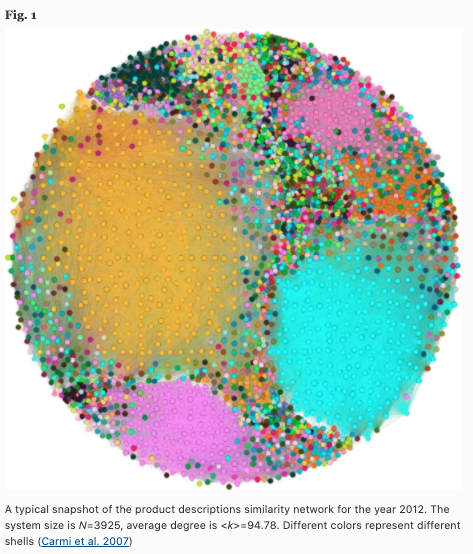
Now let's start explaining the actual network construction. For each year, we construct a weighted undirected network based on the aforementioned product similarity. Nodes correspond to each company, links correspond to the similarity between nodes, and have their similarity $w$. We allow links to be stretched if their similarity is greater than a threshold (here $10^{-4}$).
The figure below thus shows the similarity network for the 2012 version of the product. The number of nodes is now 3925 and the average degree is 94.78. Note that the colors represent specific shells.
Creating topological features of a network
Topological measures of networks have been used to predict the future profit and bankruptcy probabilities of companies. Based on the methods of Rosen et al. and Naaman et al. the authors compute for each node a vector representing a set of topological features to produce a topological network attribute vector (NAV) The following features are used in the NAV.
- degree
- Mid-centricity
- A measure of the centrality of a node, which is considered important if it forms a bridge between many other nodes
- ethnocentricity
- This is also a measure of the centrality of a node, and it becomes larger the smaller the sum of the shortest path lengths from all nodes other than itself to itself.
- distance distribution moment
- Calculate the distribution of distances from each node to all other nodes using Dijkstra's algorithm, and take the first and second-order moments of this distribution
- flow
- Defined as the ratio of direct to the undirected distance between this node and all other nodes
- network motif
- A pattern of connected small subgraphs, calculated using an extension of the Itzchack algorithm (extension to undirected graphs)
- For each node, calculate the frequency of motifs in which this node participates
- K-core
- maximal subgraph containing only vertices of degree k or greater.
Network Analysis
We will now present the results of some analyses carried out by the authors to confirm the properties of the network obtained by the proposed method.
Trends in the strength of links between companies
Consider the probability density function $p(w)$ of the link strength w of the network in each year. The following figure shows the results for six years, and we can see that the trend is the same for each year and follows an approximately exponential distribution.
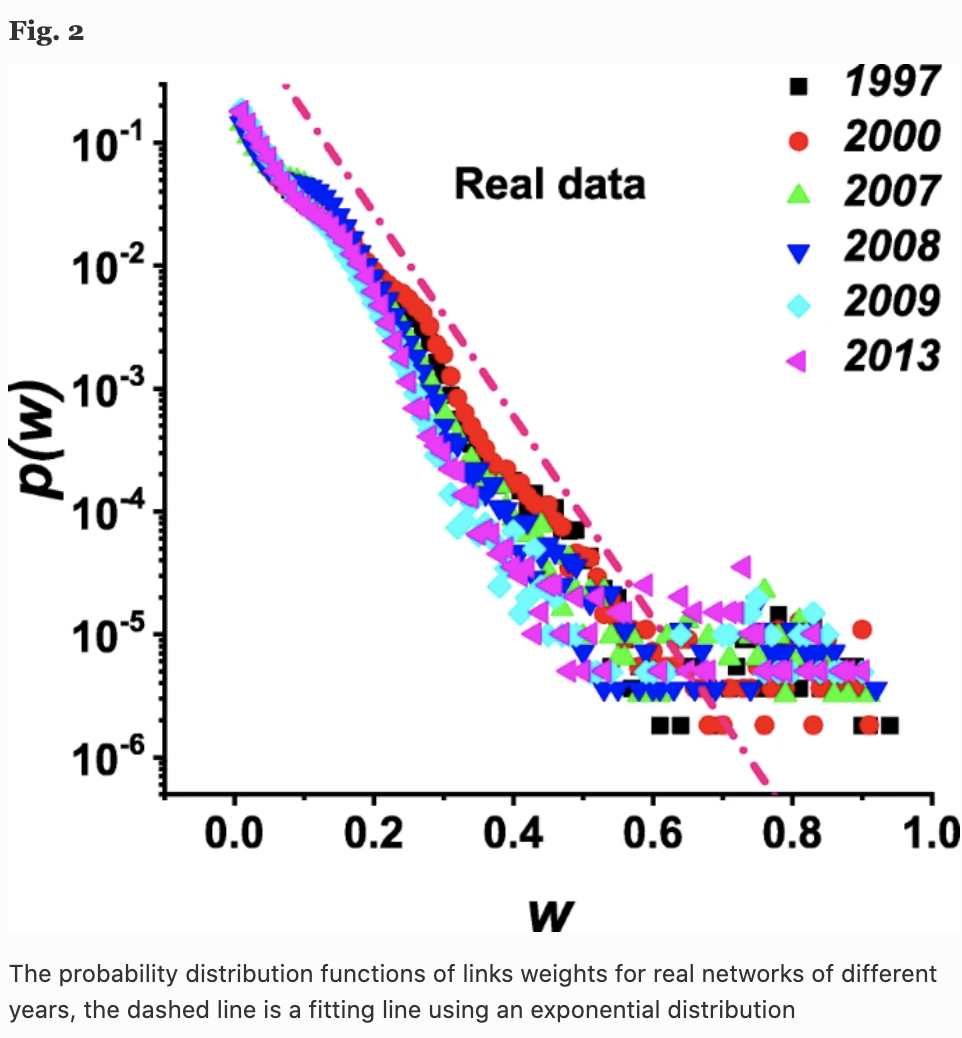
Note that the value of product similarity may reflect product market synergies or M&A competition, and a higher $w$ may imply that the two firms are highly competitive or have a cooperative relationship.
Weighted order of nodes
We calculate the weighted order, defined as follows
$$s_i = \sum_{j = 1}^N a_{ij}w_{ij}$$
where $a_{ij}$ is the adjacency matrix and $s_i$ is the strength of node $i$ quantified by the total weight of its connections. In the case of product similarity networks, this is supposed to reflect the importance or influence of company $i$ in the network. In the figure below, we can see that the strength $s(k)$ of a node of degree $k$ increases with the value of $k$ according to $s \sim k^{\beta}$.
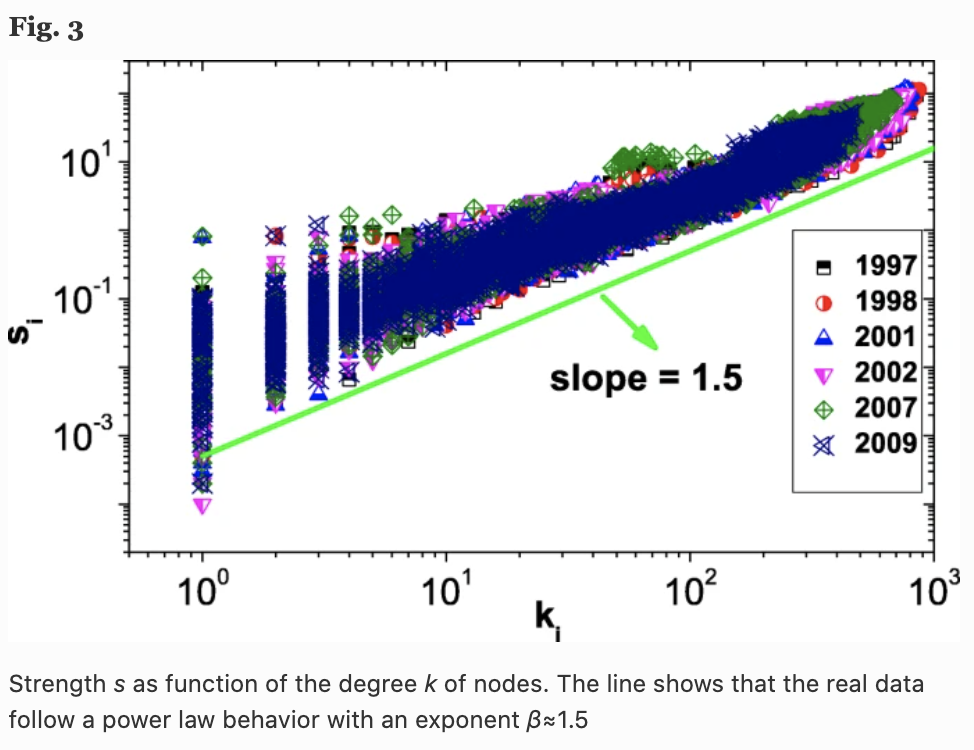
In fact, we can also see that the value of this power law $\beta$ is about 1.5, which means that the strength of a node grows faster than its degree. This means that the edge weights of the nodes (companies) with higher degrees of connectivity tend to have higher values.
Cluster coefficient
In the case of weighted networks, the clustering coefficient of node $i$ is defined as the geometric mean of the weights of the edges of the subgraph as follows The cluster coefficients are calculated for each node and further analyzed by finding the average cluster coefficients for each network in each year.
$$c_i = \frac{1}{k_i(k_i - 1)} \sum_{j,k} (\hat{w_{i,j}}\hat{w_{i,k}}\hat{w_{j,k}})^{\frac{1}{3}}$$
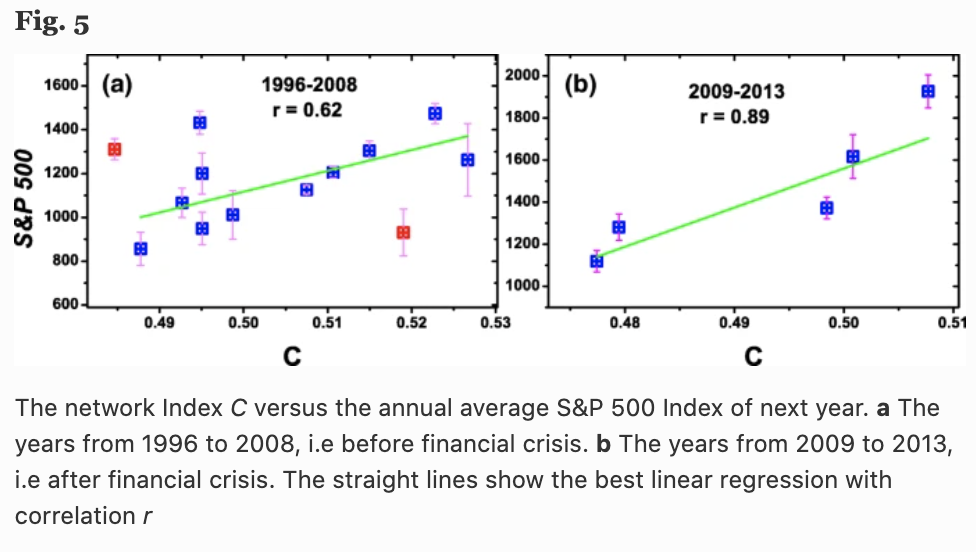
In the figure below, (a) shows the change in the average cluster coefficient $C=\frac{1}{N} \sum_{i=1}^N c_i$ over time (years), and (b) shows the S&P 500 Index. Interestingly, we can see that there is a high correlation between the average cluster coefficient $C$ (one year ahead) and the behavior of the S&P 500 Index (Fig. 5).
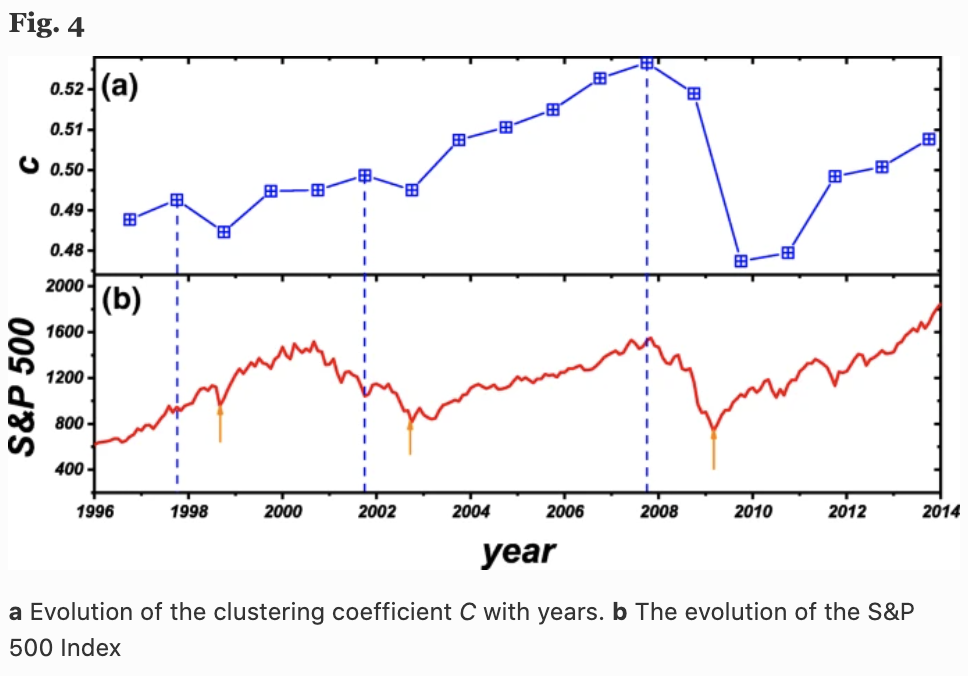
Here in Fig. 4, we see three local $C$ maxima (dashed blue lines) and three local S&P 500 minima (red arrow lines), which represent three financial crises (Asian financial crisis, the dot-com bubble, Lehman shock, etc.). The local maximum of $C$ is always one year before the minimum of the S&P 500. This implies that the network's average cluster coefficient $C$ may help predict stock market returns in the following year.
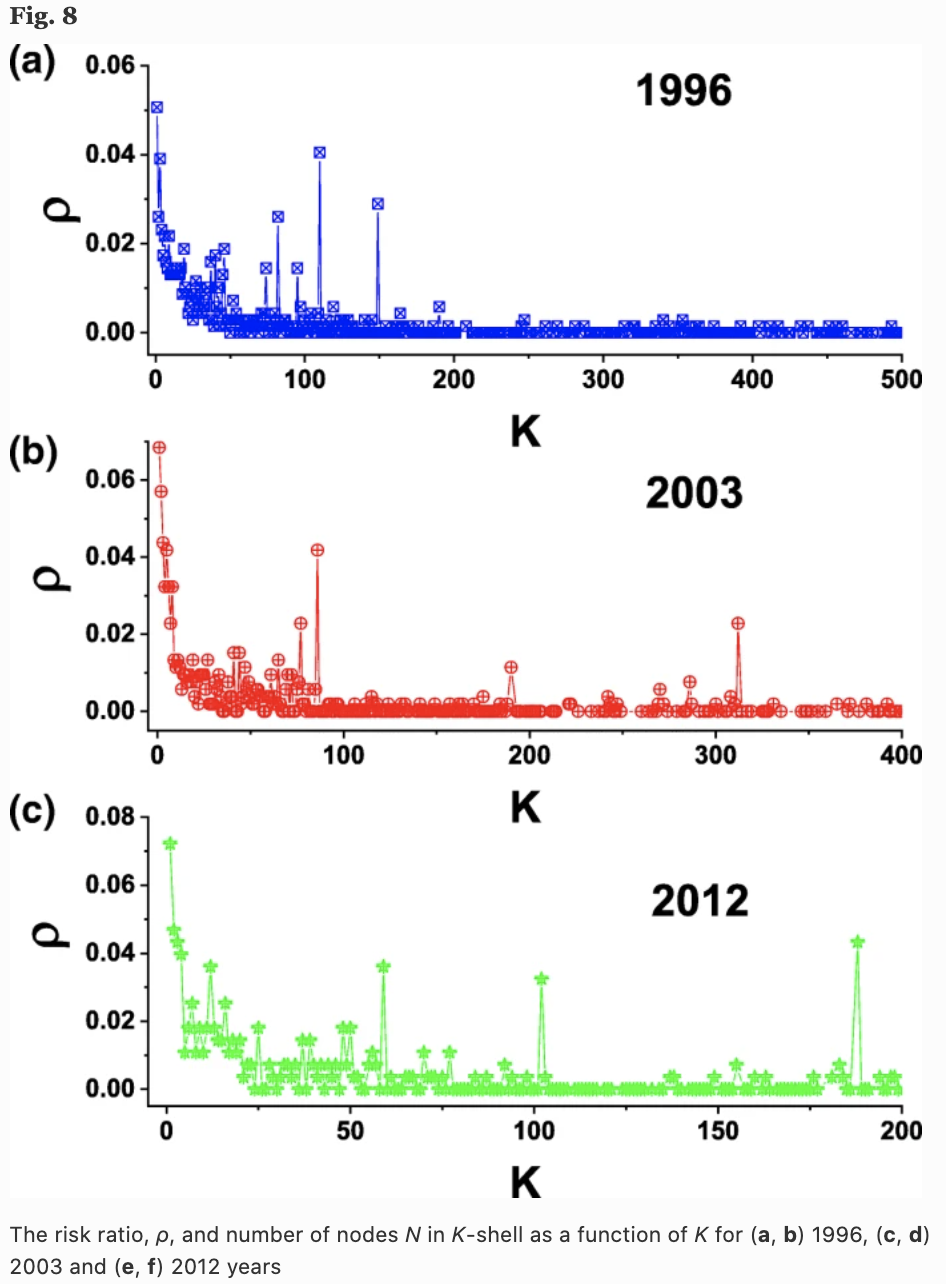
Analysis of k-shell structure
To show the importance of the topological features of the network, we also analyze the k-shell structure. The figure below shows the ratio $p$ of companies that disappeared in the following year in each order shell for three years, 1996, 2003, and 2013. It can be seen that the risk of bankruptcy is higher for companies belonging to the outer order (although this may be natural in the sense that products that sell well are produced by many companies).
Experiment
This concludes our introduction to the characteristics of networks. Next, we use the constructed network with the topological features of the network, and actually, train and verify the performance We now use the topological features of the constructed network to train and verify the performance.
Experiment setup
Of the network in a given year, 70% of the nodes are split into a training data set and the remaining 30% into a test set. NAV is calculated for each node, and it is further labeled as to whether the firm went bankrupt (and merged or privatized) in the following year, and whether it was within the top 5% (Top) of returns in the following year. We train these labels in a random forest and test whether they are better than the random case (AUC:0.5).
experimental results
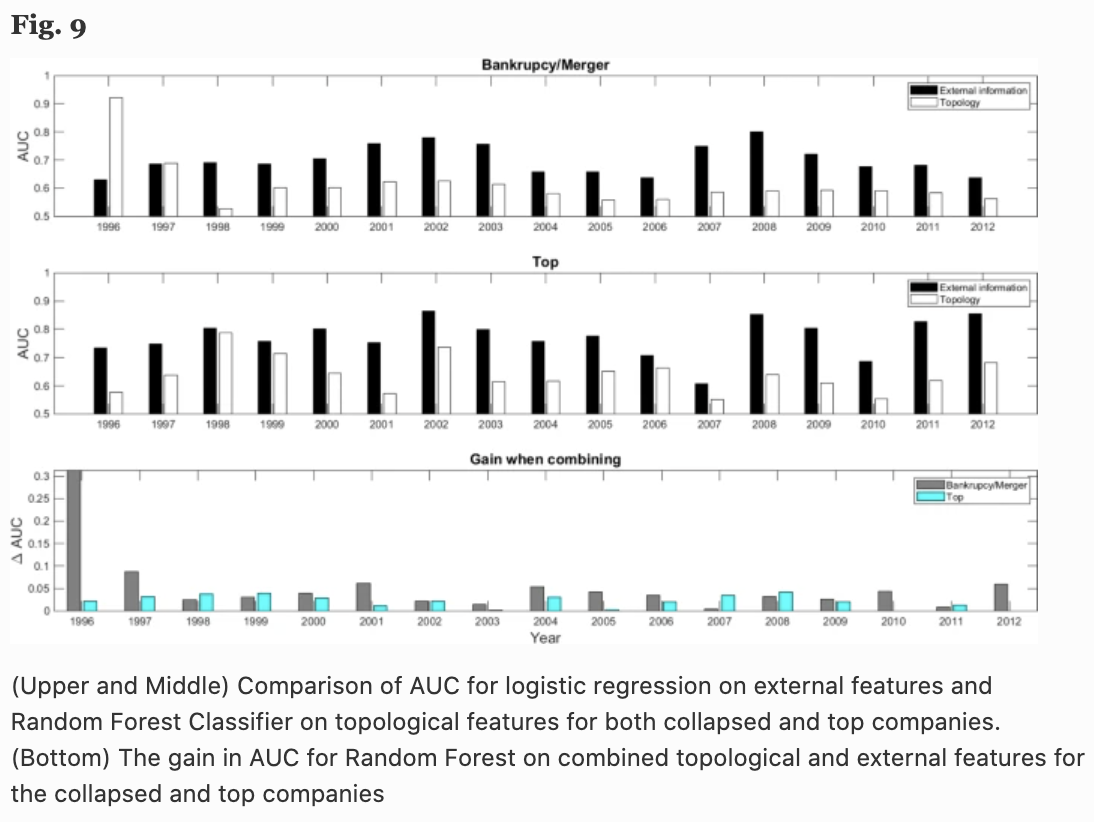
The top panel of Fig. 9 shows the AUC for bankruptcies and mergers, and the middle panel the AUC of predicting whether the next year's return is within the top 5% or not. We can see that the topological information of the proposed network is better than that of the random prediction (AUC: 0.5) for all 17 years measured.
For comparison purposes, I have also included the AUC of logistic regression based on the standard financial metrics of company size, profitability, prior year returns, investment, liquidity, leverage, book-to-market ratio, and Altman Z-score (black bars). bar graph).
It may seem like a bad result when you look at these results, but the product similarity network alone is inferior to the prediction by the financial indicators mentioned above. However, the lower part of Fig. 9 shows the increase in AUC when the aforementioned financial indexes are combined with the topological features of the product similarity network, and the accuracy is significantly improved in almost all years and categories. In other words, the results suggest that the topological information of the network proposed by the authors can play an important role in predicting future bankruptcies and returns, and can complement the traditional method using logistic regression.
We also experiment with classifying bankruptcies and mergers as separate categories because they have different meanings even when the same node (firm) disappears (Fig. 10), although we use the same labels for bankruptcy, merger and privatization in Fig. 9.
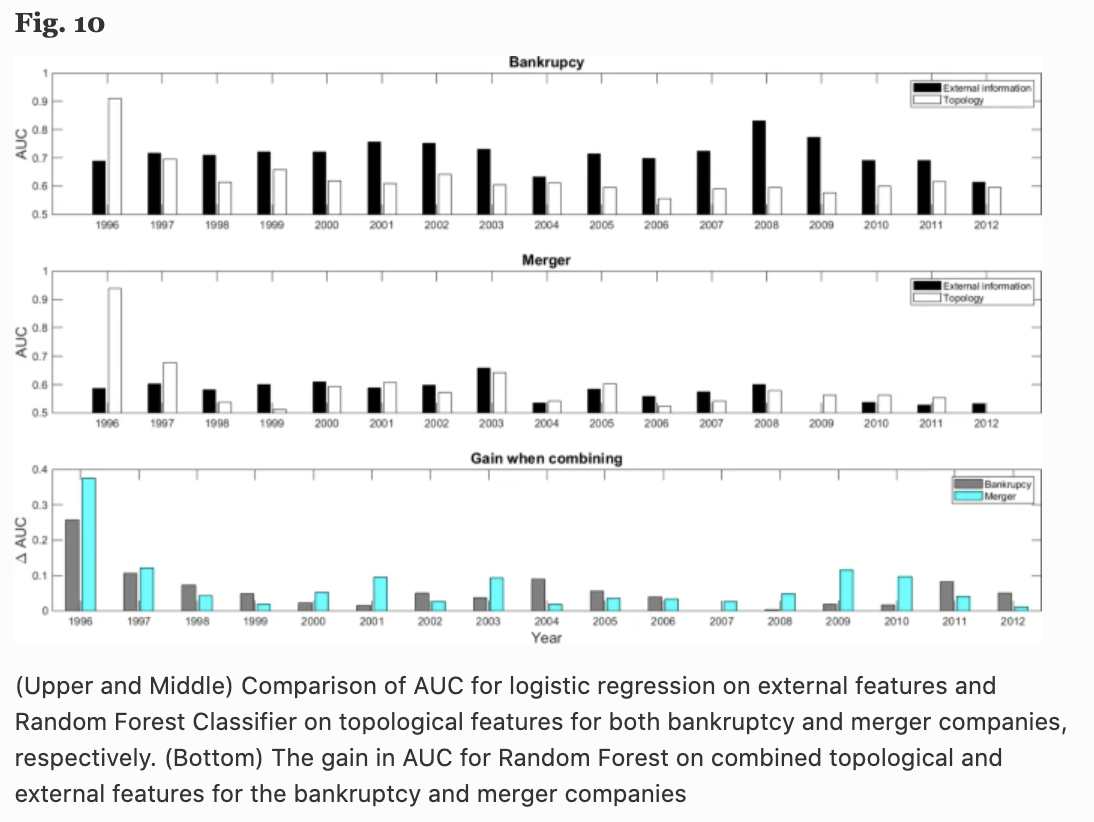 The results show that in the case of bankruptcy, internal information of the company such as financial information is important, while in the case of a merger, both topology and financial information are important. However, we can see that in both cases, the combination of topological information gives better results.
These results show that the topological features of the network constructed from product similarity are useful in predicting the future performance of a company.
Summary
I have tried to introduce some interesting methods that are being used in the field of economic and stock prediction. This time, it was a combination of text analysis, network science, and machine learning. method, but there are other methods as well. This field is like a mixed martial art that deals with all kinds of data and methods, and I think that by combining more advanced methods such as NLP, CV, deep learning, and reinforcement learning, we can come up with more interesting ideas. There's a lot of ways to do this, depending on the idea. I think it's a very interesting topic.
If there are any interesting approaches, I'll try to introduce them again.


Categories related to this article