No Learning Required To Evaluate The Architecture! What Is Zero-Shot NAS [Zen-NAS]?
3 main points
✔️ Proposed Zen-Score, a Zero-Shot metric for NAS, and Zen-NAS using it
✔️ Achieved ImageNet-top-1 accuracy of 83.6% in 0.5 GPU days
✔️ Achieved a very high level of search method compared to existing methods
Zen-NAS: A Zero-Shot NAS for High-Performance Deep Image Recognition
written by Ming Lin, Pichao Wang, Zhenhong Sun, Hesen Chen, Xiuyu Sun, Qi Qian, Hao Li, Rong Jin
(Submitted on 1 Feb 2021 (v1), last revised 23 Aug 2021 (this version, v4))
Comments: Accepted by ICCV 2021
Subjects: Computer Vision and Pattern Recognition (cs.CV); Machine Learning (cs.LG)
code:

The images used in this article are from the paper, the introductory slides, or were created based on them.
first of all
In Neural Architecture Search (NAS), which is a method to search for the optimal neural network architecture, reducing the computational cost is a very important issue. For example, in AmoebaNet, it takes about 3150 GPU days to search for an architecture, which is an extraordinary computational cost when NAS was first introduced.
To address this issue, various methods have been proposed to reduce the computational complexity, such as One-Shot NAS (e.g., 1, 2 ), which trains a huge supernet and then evaluates the performance of its internal subnets, and methods that predict the final performance during the training of the model.
In the paper presented in this article, we proposed Zen-Score, which is a Zero-Shot metric for evaluating architecture performance. Zen-NAS, which uses the Zen-Score as a proxy for evaluating architectural accuracy, successfully explores architectures faster and with higher accuracy than existing NAS methods.
Zen-Score
The Zen-Score, a Zero-Shot metric for evaluating the performance of architectures, contains two major proposals.
- A measure of the expressive power of the Vanilla Convolutional Neural Network (VCNN), $\Phi -Score$.
- $Zen-Score$ with $\Phi -Score$ modified for actual architecture accuracy evaluation
The Vanilla Convolutional Neural Network (VCNN) is a simple architecture in which each layer consists of one convolutional operation and a RELU activation function. The following sections describe $\Phi -Score$ and $Zen-Score$ in turn.
About $\Phi -Score$
The $\Phi -Score$ presented in the original paper is a measure of the expressive power of the Vanilla Convolutional Neural Network (VCNN).
... On the expressive power of neural networks
The $\Phi -Score$ is based on existing theoretical work on the expressive power of neural networks.
A particularly important finding is that a vanilla network (whose activation function is a piecewise linear function such as RELU) can be decomposed into linear functions conditional on the activation pattern. Let $A_t(x)$ be the activation pattern of the $t$th layer, then any vanilla network $f(\cdot)$ can be expressed by the following equation
$f(x|\theta)=\sum_{S_i \in S}I_x(S_i) W_{S_i}x$
In this case, $S_i$ is a linear region (convex polytope) corresponding to the activation pattern $\{A_1(x),A_2(x),A_L(x)\}$, $I_x(S_i)$ is a function that is 1 when $x \in S_i$ and 0 otherwise, and $W_{S_i}$ is a coefficient matrix. (Also, auxiliary structures used in modern networks, such as Residual connection, Batch Normalization, Self-Attention block, etc., do not affect the expressiveness of the network significantly. Therefore, when measuring expressivity, these auxiliary structures are temporarily removed and then re-added during the training and testing phase).
For a number $|S|$ in a linear domain
In existing theoretical studies, the number of linear regions of vanilla networks, $|S|$, has been used as a measure of the expressive power of the network.
For example, Montúfar et al. showed that deep layer NNs have more linear regions than shallow layer NNs, demonstrating the theoretical superiority of deep neural networks. The fact that having many linear regions can be used as a measure of the expressive power of a network can be seen, for example, in the following figure from the same paper.
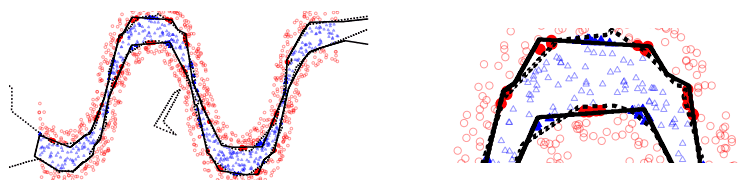
This figure shows the decision bounds for a 1-layer (solid line)/2-layer (dotted line) trained model with the same total number of units. In the example in the figure, we can see that the two-layer model (dotted line) has more linear parts and approximates the proper boundary more accurately.
On the coefficient matrix $W_{S_i}$ and the associated Gaussian complexity
As shown in the previous equation, the vanilla network is decomposed into a linear function $f(X)=W_{S_i}X$ corresponding to a linear domain $S_i$.
Gaussian complexity($G(F)=E[sup_{f \in F}\frac{1}{n}\sum^n_{i=1}f(x_i)\epsilon_i]$, $\epsilon_i~N(0,1)$), which is regarded as a measure of the complexity of a set of real-valued functions $F$. The following relations hold with respect to For a linear function class $f:f(X)=WX s.t. ||W||_F \leq G$, $O(G)$ is an upper bound on the Gaussian complexity. Thus, not only the number of linear domains $|S|$, but also the Gaussian complexity associated with the coefficient matrix $W$ (Frobenius norm of $|W||$) can be used as a measure of the expressive power of the vanilla network.
$\Phi -Score$
As mentioned earlier, the Gaussian complexity associated with the number of linear domains $|S|$ or the coefficient matrix $W_{S_i}$ may be used as a measure of expressiveness.
In practice, however, it is computationally infeasible to measure the number of linear regions $|S|$ on a large network, and it is difficult to use it as a metric. Based on these findings, $\Phi -Score$ is defined as the expected value of the Gaussian complexity of the vanilla network $f(\cdot)$.
$\Phi(f)log E_{x,\theta} \{\sum_{S_i \in S}I_x(S_i)||W_{S_i}||_F\}$
$=log E_{x,\theta} ||\nabla_x f(x|\theta)||_F$
As a result, $\Phi -Score$ is equivalent to computing the expected value of the gradient norm of $f$ for input $x$.
About Zen-Score
Computational challenges for $\Phi -Score$.
As mentioned above, the $\Phi -Score$ is defined as a criterion for the expressiveness of vanilla networks, but there are challenges in actually applying it to NAS.
Specifically, computing the $\Phi-Score$ of a very deep network would result in overflow due to gradient explosion without the BatchNormalization layer.
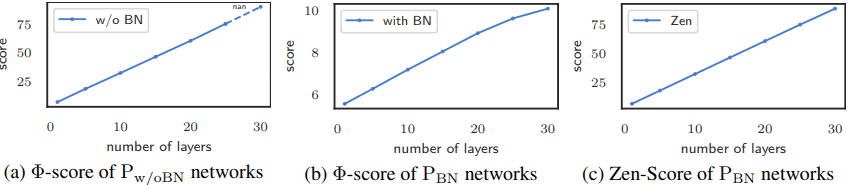
As shown in Figure (a), an overflow occurs when the number of layers reaches 30. On the other hand, when $\Phi-Score$ is calculated with the BatchNormalization layer, $\Phi-Score$ becomes very small as shown in Figure (b) (note the value of the vertical axis).
To deal with this phenomenon (BN-rescaling), $\Phi-Score$ is modified to become Zen-Score.
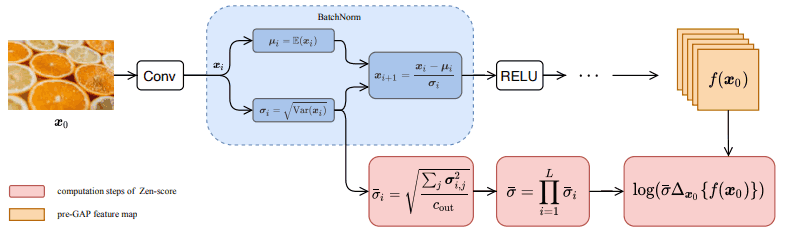
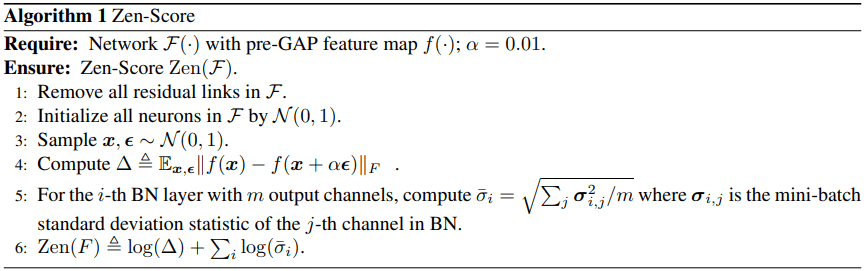
Zen-Score
The Zen-Score calculation method and pipeline is as follows
About Zen-NAS
Zen-NAS, the Zero-Shot NAS algorithm ultimately derived in the original paper, is a method for searching for architectures that maximize the Zen-Score. Zen-NAS uses an Evolutionary Algorithm (EAL), which is as follows
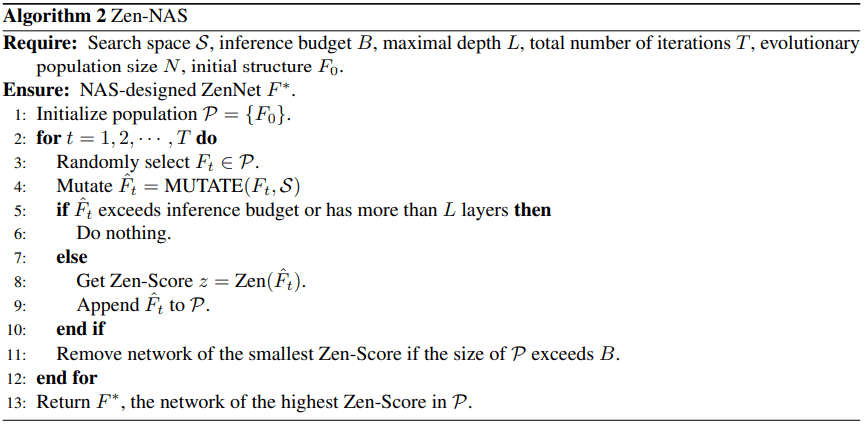
MUTATE represents a mutation in an evolutionary algorithm, specifically
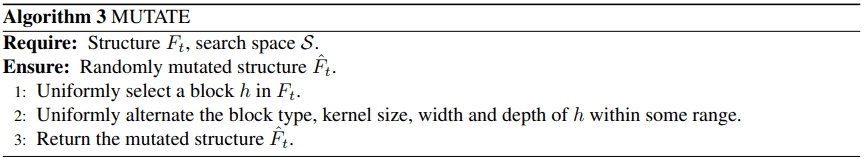
The width and the depth of the layer in the mutation are mutated in the range [0.5, 2.0].
After $T times $ iterations, the architecture with the largest Zen-Score is named ZenNets and is the output of Zen-NAS.
experimental results
Experiment setup
The experiments were performed on CIFAR-10/CIFAR-100 and ImageNet-1k.
Comparison with existing Zero-Shot proxies
First, the results of the comparison experiment with the existing Zero-Shot proxy in the same search space, search strategy, and learning settings are shown below.
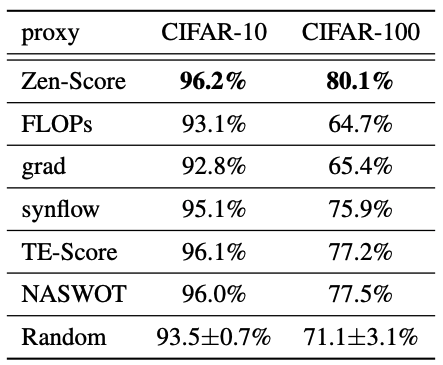
We can see that the results are superior to the existing methods. Also, the computation time for ResNet at 224x224 resolution is as follows
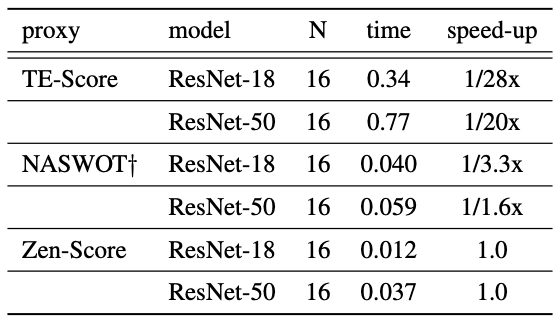
The $N$ and $time$ in the table mean that it takes $time$ seconds to process $N$ images. Compared with existing Zero-Shot proxies, our results also show that the computational efficiency is superior.
Performance comparison between ZenNets and existing models
The following is a performance comparison between ZenNets and the existing model on the ImageNet dataset using Zen-Nas on NVIDIA V100 GPUs with FP16, batch size 64, and 0.5 GPU days.
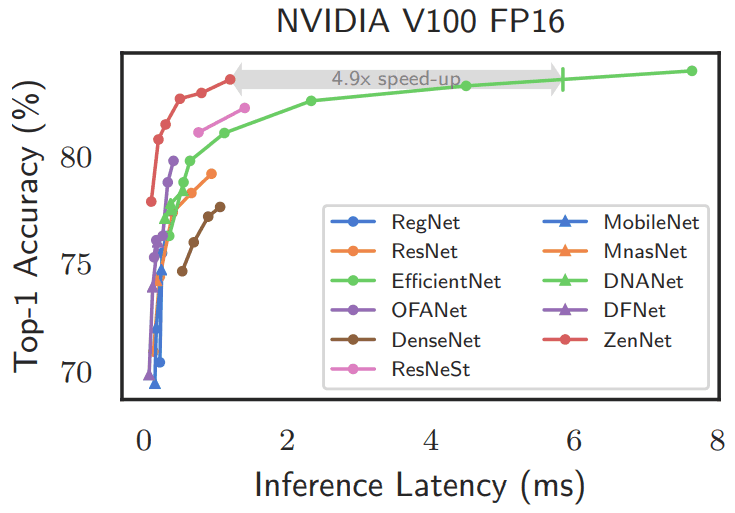
As shown in the figure, ZenNets significantly outperforms the existing methods in terms of both top-1 accuracy and inference time.
The results of the search for lightweight networks with computational complexity limited to 400/600/900M FLOPS are shown below.
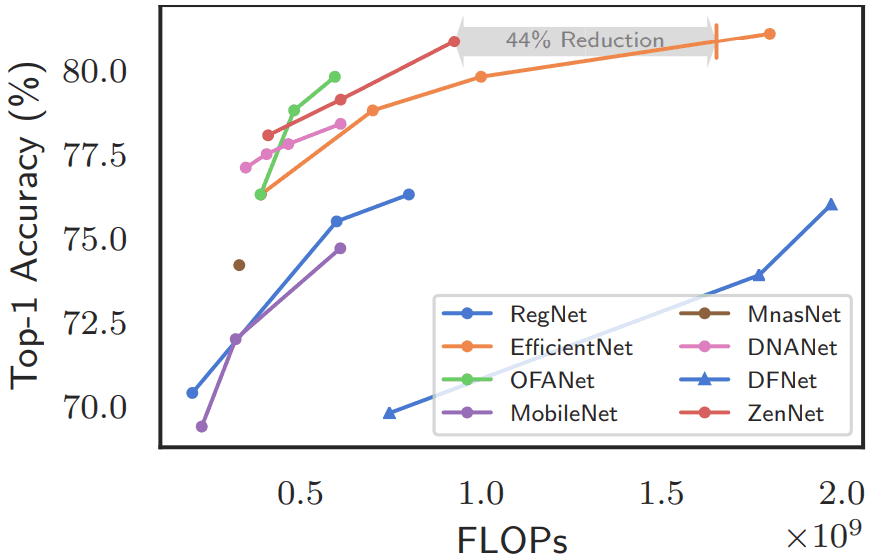
ZenNets has shown excellent results in this case as well.
Comparison between Zen-NAS and existing NAS methods
The results of the comparison between Zen-NAS and existing NAS methods are as follows
However, since it is difficult to make comparisons under the same conditions, the best models and computational costs for each method are provided.
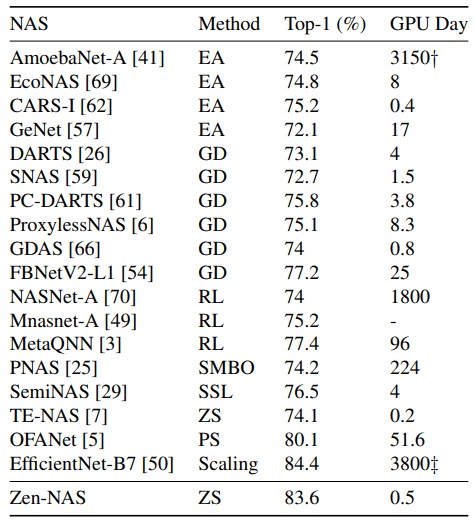
For the methods in the table, EA indicates Evolutionary Algorithm, GD indicates Gradient Descent, RL indicates Reinforcement Learning, ZS indicates Zero-Shot, and others indicate unique special search methods. In general, Zen-NAS is shown to be very high in both Top-1 accuracy and search time.
summary
In this article, we introduced the proposed Zen-Score, which is a criterion for network expressiveness, and the paper that proposed Zen-NAS to maximize it.
Zen-NAS successfully explores architectures faster and with higher accuracy than existing NAS methods. As introduced in the article, the Zero-Shot metric used in Zen-NAS, Zen-Score, is proposed based on theoretical studies on neural networks (Montufar et al., Xiong et al. See the original paper for other details), and it is proposed based on these studies.
It is also a case where the theoretical research on neural networks is shown to be useful for understanding efficient network design, and it is very interesting research that is expected to lead to the activation of theoretical research in the future.


Categories related to this article