How Do CNNs And Transformers Compare To Human Vision?
3 main points
✔️ Compare Transformers and CNNs to human vision.
✔️ Introduce new metrics to compare neural networks to human vision.
✔️ Compare the shape/texture biases of ViT and CNNs with human vision.
Are Convolutional Neural Networks or Transformers more like human vision?
written by Shikhar Tuli, Ishita Dasgupta, Erin Grant, Thomas L. Griffiths
(Submitted on 15 May 2021)
Comments: Accepted at CogSci 2021
Subjects: Computer Vision and Pattern Recognition (cs.CV)
code:
Introduction
Convolutional Neural Networks (CNNs) is the current state of the art for computer vision tasks like image classification, image segmentation, and object detection. Self-attention-based transformers have also proven to be effective and could replace CNNs in the near future.
CNNs have some similarities to the visual cortex of humans. They are translation invariant, as the same weights are used for each image patch. Nevertheless, the local connectivity can lead to the loss of global context, making these models dependent on texture rather than shape. On the contrary, humans use shape instead of texture to recognize images. Thanks to the eliminated inductive bias, transformers like ViT on the other hand, are able to also capture global features effectively. They are more flexible than CNNs, which has given them great success in both NLP and vision. The objective of this paper is to investigate how close ViTs and CNNs are to human image recognition using several pre-existing metrics like Cohen's Kappa, shape bias, and newer metrics like class-wise and inter-class JS distances.
Measuring Error Consistency
There is only one way to be right, but there are many ways to be wrong. The accuracy of a model allows us to compare which model is better, but it is not useful in understanding what kind of mistakes a model makes.
Systems differ in the way they misclassify things. In order to measure the similarity of two systems based on how they misclassify things, we can simply consider how many of the individual trails are identical. This is the observed error overlap which measures the agreement of the two systems: cobs(i,j) = e(i,j)/n.
Let us consider a system that classifies with an accuracy of pcorrect. This is equivalent to randomly sampling from a binomial distribution. Two such models will have higher observed error overlap as pcorrect increases. The expected overlap is given by cexp(i,j) = pipj + (1-pi)(1-pj). Using this value for normalization, the error consistency can be calculated as follows:

Ki,j is called Cohen's kappa and can be used to compare humans and neural networks. Unfortunately, it is difficult to interpret where the differences in classification are using Cohen's kappa.
The confusion matrix consists of detailed information about how much of which classes are classified and misclassified. Nevertheless, for a dataset like ImageNet with 1000 classes, the non-diagonal elements are very sparse, and collecting adequate human data to fill this 1000x1000 matrix is difficult. Therefore, we resort to clustering the 1000 classes into 16 categories and evaluate the confusion matrix thus obtained. We create a probability distribution of errors over class C by computing the number of times the elements from each class are misclassified (ei) and normalizing with the net number of errors made.

Then, the Jensen-Shannon (JS) distance is measured, which is a more symmetric and smoothed version of KL divergence. Two models with lower JS distance make similar misclassification. Also, JS score is independent of accuracy (m is the point-wise mean of the two distributions).

As shown below, we also compute the class-wise JS distance by calculating how much of which classes were misclassified. To get the ei in this case, the columns of the confusion matrix are summed up. Experimentally, the class-wise JS distance was found to be inversely correlated with cohen's k.

Furthermore, we also compute the inter-class JS distance by using the error counts from the non-diagonal elements of the confusion matrix (CM). The inter-class JS distance is an even more fine-grained measure of similarity where we consider the probability of confusing any class 'i' by another class 'j' (i,j∈C). Experimentally, the inter-class JS distance was found to be uncorrelated with cohen's k.
![]()
Comparisons and Results
We compare the error consistency of several CNNs (ResNet, AlexNet, VGG), and Transformers (ViT) with human prediction errors. These models were tested on the specially designed Stylized ImageNet dataset (SIN).
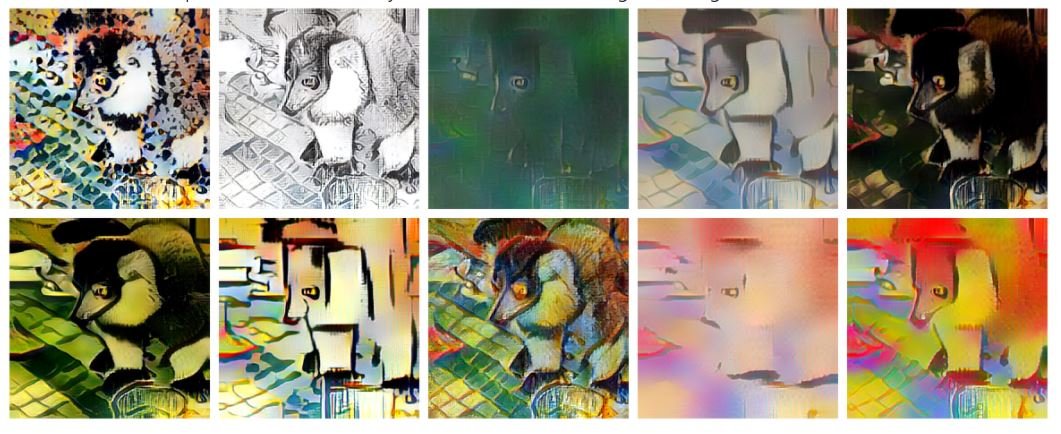
As shown in the picture above, this dataset uses texture-based style transfer to generate a conflict between texture and shape. This feature can be used to calculate how much a model is a shape/texture-biased. The results are presented below:
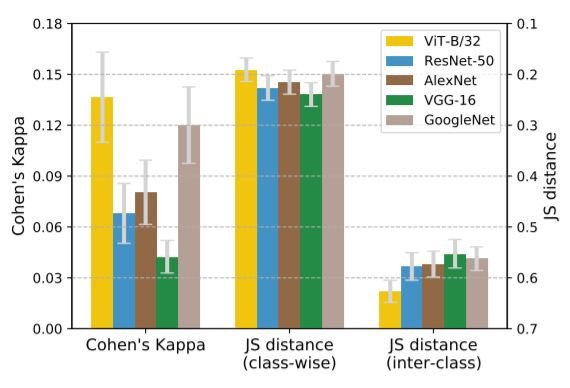
The above diagram shows the error consistency results on the SIN dataset. The JS distances have been plotted in decreasing magnitude to highlight similarities in pattern with Cohen's k. Also, note that a lower JS distance and higher Cohen's k indicate higher error consistency with humans.
If we consider Cohen's K and class-wise JS distance, we can see that ViT makes mistakes similar to humans. But surprisingly, the inter-class JS distance of ViT is larger than CNNs. So, when we look at how much of each class is misclassified (class-wise JS), ViT is more closer to humans. On the other hand, when we look at how much of each class is misclassified as each of the other classes(inter-class JS), CNNs and Humans seem closer. Even though the original paper emphasizes ViT to be more human-like based on class-wise JS distance, the inter-class JS distance is a more fine-grained measure and cannot be neglected. Considering the full error distribution, ResNets indeed outperform ViT in similarity to humans. In the next section, we compare another indicator of similarity between human vision and neural networks: shape bias.
Shape Bias
Humans are shape biased i.e. they usually use the shape of an object over its texture to identify it. Similarly, for a model, the shape bias is defined as " the percentage of the time the model correctly predicts the shape for trials on which either shape or texture prediction is correct". The results on the SIN dataset were used to evaluate if a model is texture biased or shape biased. The figure below shows the fraction of shape-based and texture-based decisions of each model for different object categories.
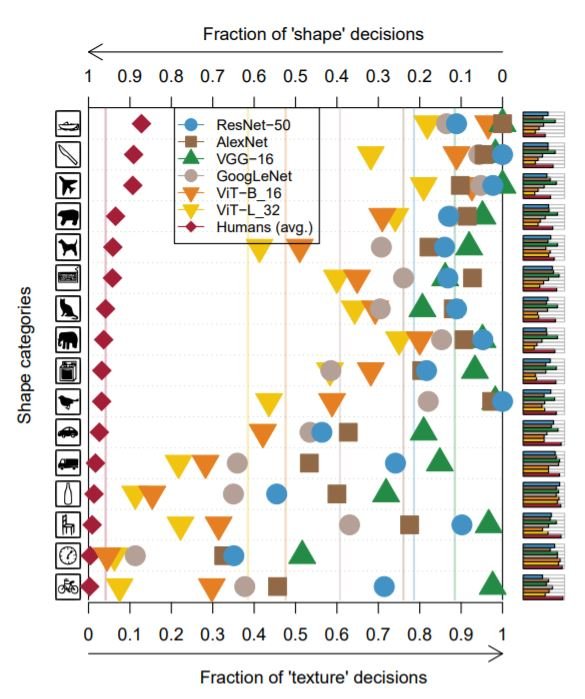
In all categories, ViT is closer to human biases, as compared to CNNs. While calculating the shape bias, the cases where shape or texture predictions are correctly made are considered as a whole. Therefore, these results are consistent with the previous observation of the lower value of class-wise JS distance for ViT, which also considers class-wise misclassifications as a whole. So, shape bias does not contain any information from the full error distribution i.e. how much of each class is misclassified as each of the other classes. That explains why these results are inconsistent with the suggestion made by inter-class JS distances previously i.e. CNNs are more closer to humans.
Fine Tuning with Data Augmentation
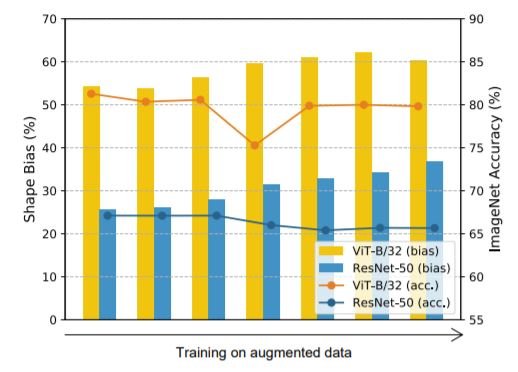
Simple data augmentations like color distortion, noise, and blur have been shown to substantially decrease the texture bias of a model, while augmentations like random crop have been shown to increase the texture bias. We finetuned all the models using data augmentation (rotation, random cutout, Sobel filtering, Gaussian blur, color distortion, and Gaussian noise) on the ImageNet dataset and performed error consistency analysis and shape-bias analysis on them.
 Change of Shape Bias with Data Augmentation
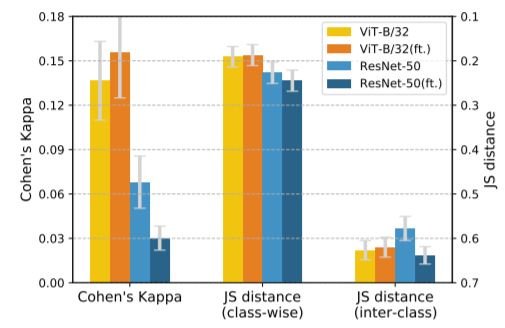 Error Consistency before and after fine-tuning(ft.)
We found that the shape bias of both ResNets and ViT increases with the use of data augmentation. The error consistency of ViT slightly improved with fine-tuning. On the contrary, although the shape bias for CNNs increases too, the error consistency of ResNets surprisingly decreases with fine-tuning. Both the inter-class JS and class-wise JS distance were found to slightly increase. This shows that while the error consistency and shape/texture biases are both indicators of similarity to human vision, they do not have a fixed relation. During fine-tuning, they appear to have a positive correlation for ViT and a negative correlation for CNN.
Summary
This paper establishes the correlation between human vision and different artificial neural network architectures. The metrics introduced in this paper help to get a fine-grained measure of this correlation. Future works could compare the error consistency of humans and other models. They could also extend the JS distance metric to measure concept-level similarity between models. One ambiguous result that requires further attention is the lower inter-class JS-distance of CNNs which suggests a greater similarity to humans. Meanwhile, the shape/texture biases of CNNs are not as consistent with humans as ViT. We instead found that ViTs are more shape-biased like humans are. We hope that developing models similar to humans could result in more efficient and accurate models.


Categories related to this article


![[MusicLM] Text-to-Mu](https://aisholar.s3.ap-northeast-1.amazonaws.com/media/October2023/musiclm-520x300.png)


